
Added
New Features and Bug Fixes
6 months ago by Alon Lesman
New & Improved
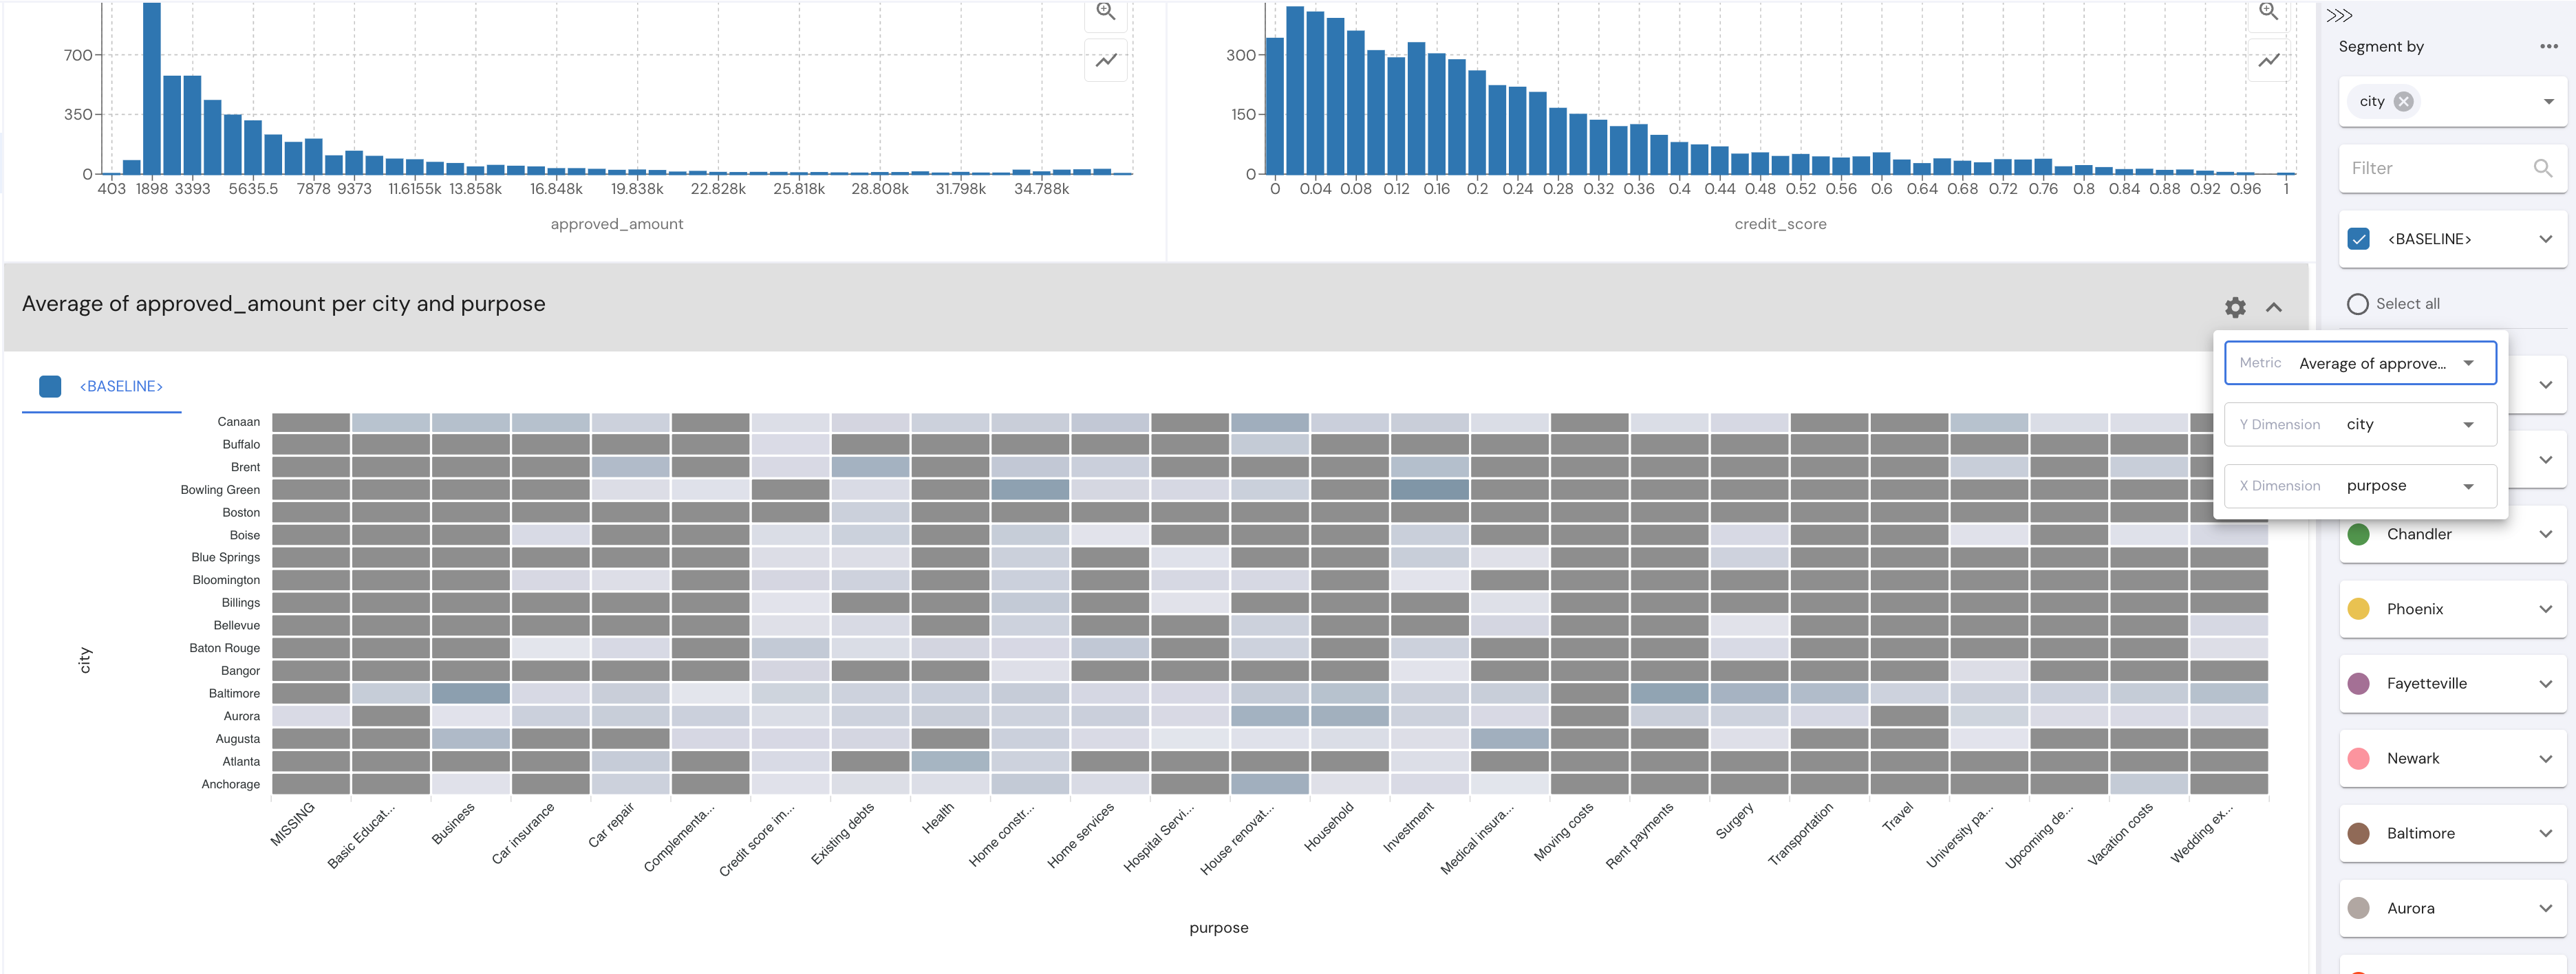
Heat Map in Investigations Page
You can now view heatmap chart on your Investigations page, making it easier to visualize data distributions and identify patterns.
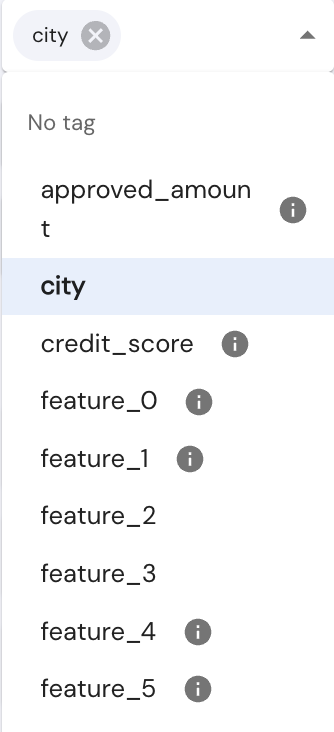
Field Description Tooltips
Add descriptions to your fields and view them across the dashboard by hovering over the information icon next to each field. This helps your team quickly understand field meanings without switching context.
Preset Improvement: Save Timestamp Field
Presets can now save your selected timestamp field.
Bug Fixes
Fixed an issue where homepage KPI charts would not display data after an empty plot was encountered.