How to Read an Insight
The Insights page on the Mona dashboard will show you all the insights that Mona generated according to your stanzas and verses configurations.
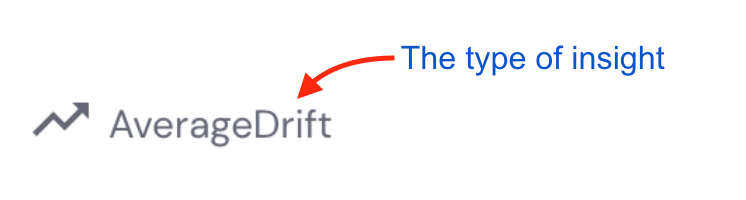
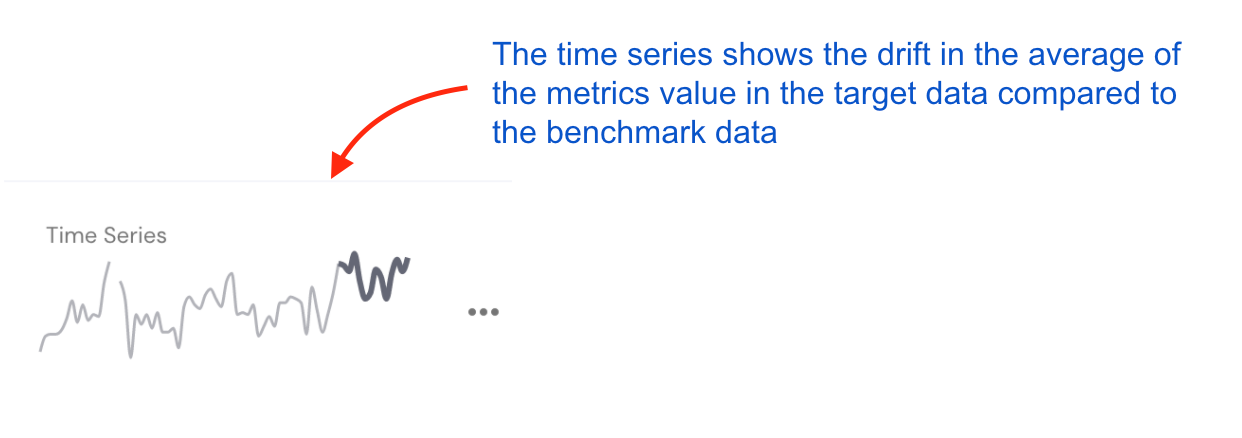
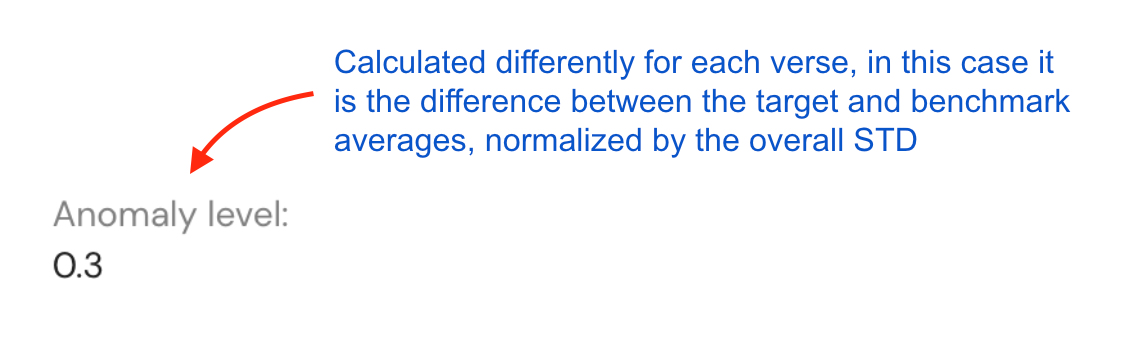
Mona can generate insights for various types of anomalies. Below we see an example for a detected drift in the average of a model's performance metric, between two different time periods, in a given segment of the data.
![Screen Shot 2022-02-14 at 16.04.27.png 2766](https://files.readme.io/b0cf026-Screen_Shot_2022-02-14_at_16.04.27.png)
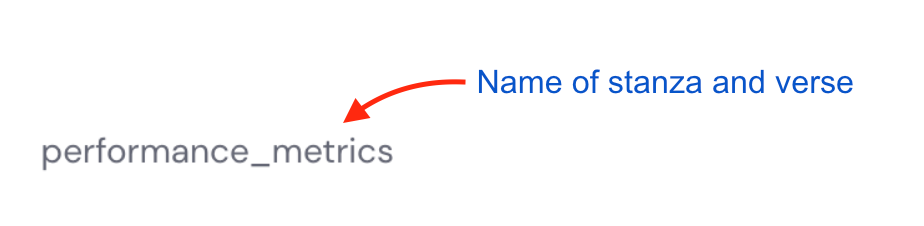
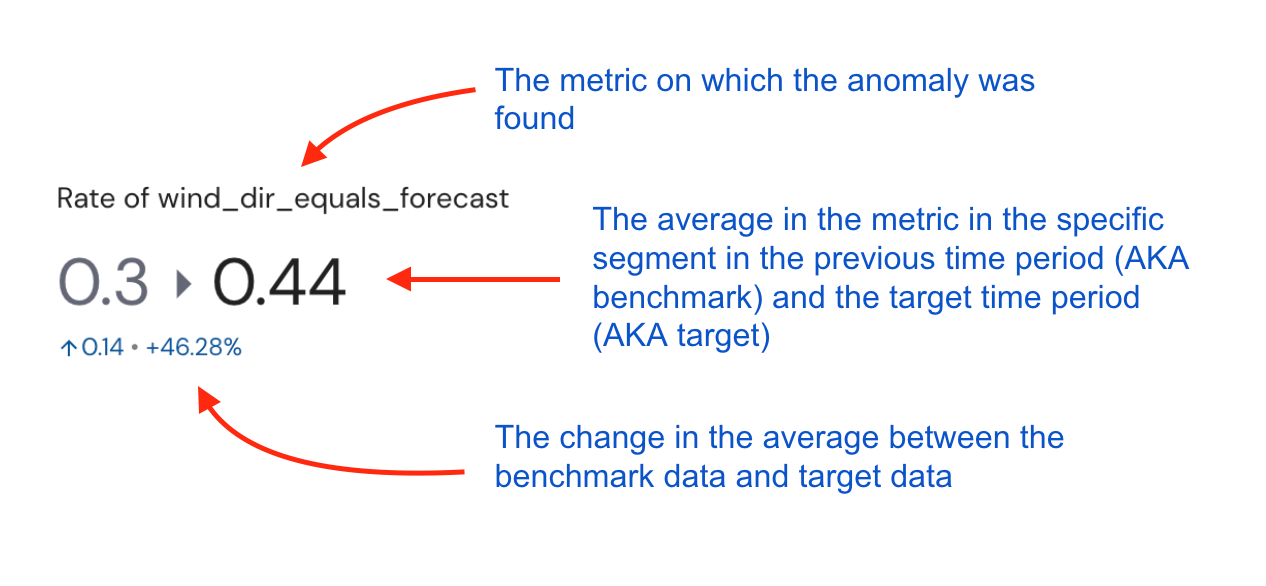
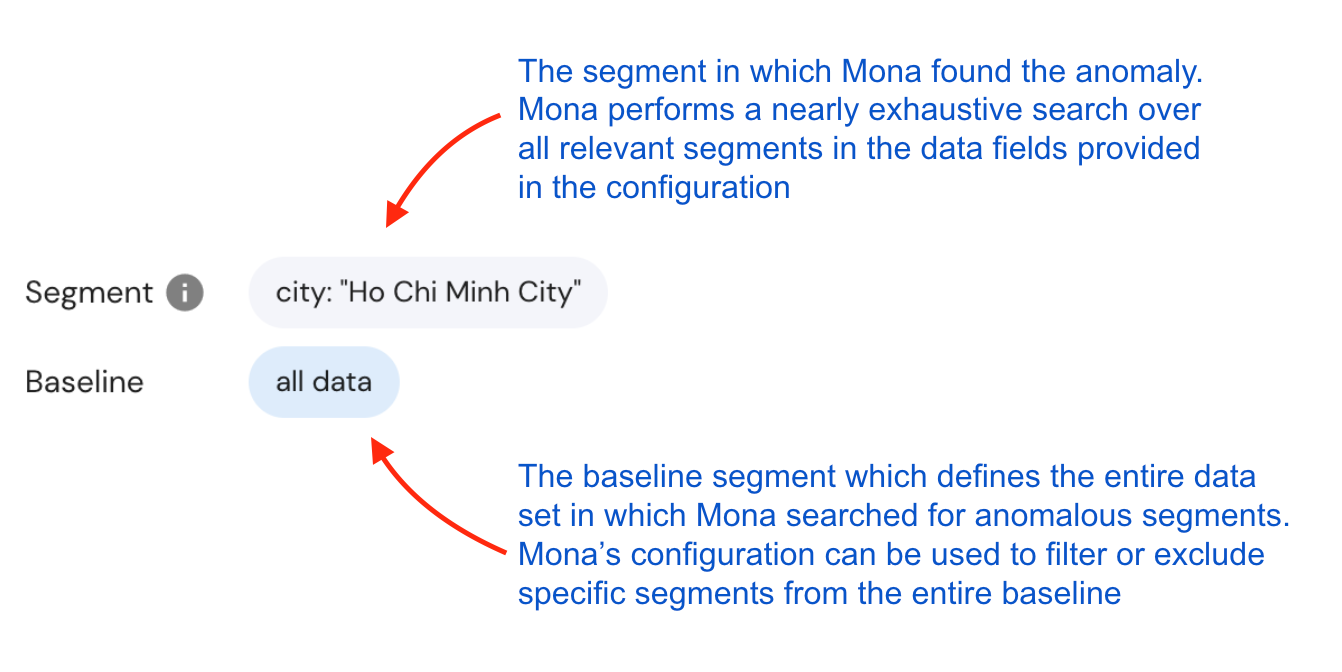
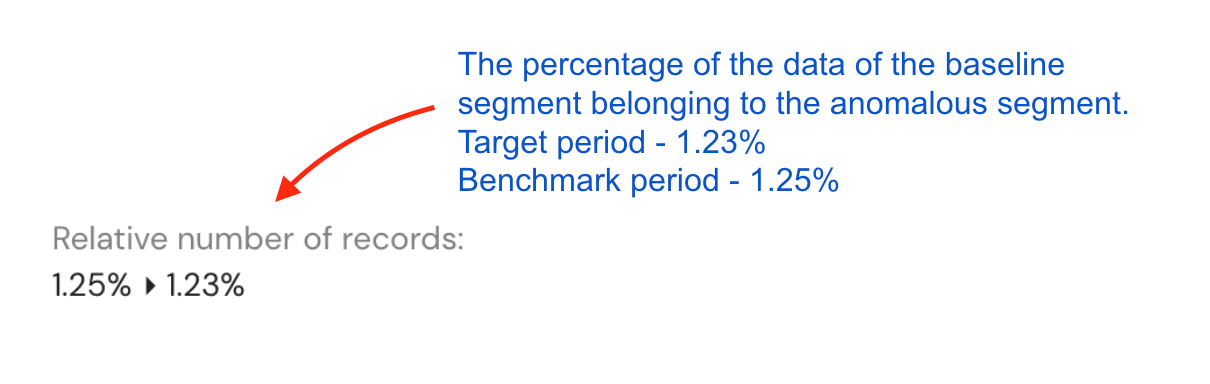
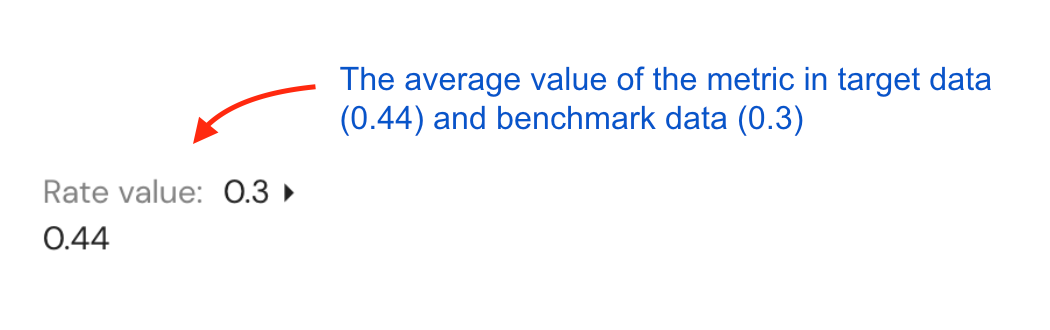
Below you will see all the aspects of an insight:
![Screen Shot 2022-02-14 at 16.10.43.png 746](https://files.readme.io/7cd067a-Screen_Shot_2022-02-14_at_16.10.43.png)
![Screen Shot 2022-02-14 at 16.12.03.png 924](https://files.readme.io/ed636a4-Screen_Shot_2022-02-14_at_16.12.03.png)
![Screen Shot 2022-02-14 at 16.15.29.png 1266](https://files.readme.io/d22e2a9-Screen_Shot_2022-02-14_at_16.15.29.png)
![Screen Shot 2022-02-14 at 16.20.49.png 1342](https://files.readme.io/0eafc10-Screen_Shot_2022-02-14_at_16.20.49.png)
![Screen Shot 2022-02-14 at 16.27.43.png 1242](https://files.readme.io/26f923a-Screen_Shot_2022-02-14_at_16.27.43.png)
![Screen Shot 2021-03-04 at 12.31.51.png 1402](https://files.readme.io/a82f6ba-Screen_Shot_2021-03-04_at_12.31.51.png)
![Screen Shot 2022-02-14 at 16.32.45.png 1228](https://files.readme.io/87872ce-Screen_Shot_2022-02-14_at_16.32.45.png)
![Screen Shot 2022-02-14 at 16.34.38.png 1210](https://files.readme.io/f9ffa02-Screen_Shot_2022-02-14_at_16.34.38.png)
![Screen Shot 2022-02-14 at 16.35.57.png 1050](https://files.readme.io/5d35028-Screen_Shot_2022-02-14_at_16.35.57.png)
![Screen Shot 2022-02-14 at 16.37.44.png 1138](https://files.readme.io/ec7b4f5-Screen_Shot_2022-02-14_at_16.37.44.png)
![Screen Shot 2022-02-14 at 16.38.53.png 1118](https://files.readme.io/54e2f1e-Screen_Shot_2022-02-14_at_16.38.53.png)
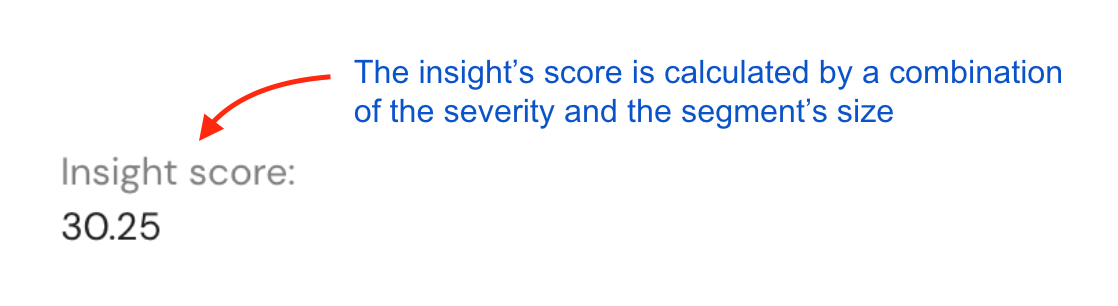
for more on insight scores, see here.
![Screen Shot 2022-02-14 at 16.40.12.png 1014](https://files.readme.io/d5c83a0-Screen_Shot_2022-02-14_at_16.40.12.png)
![Screen Shot 2022-02-14 at 16.41.11.png 892](https://files.readme.io/9b4e29d-Screen_Shot_2022-02-14_at_16.41.11.png)
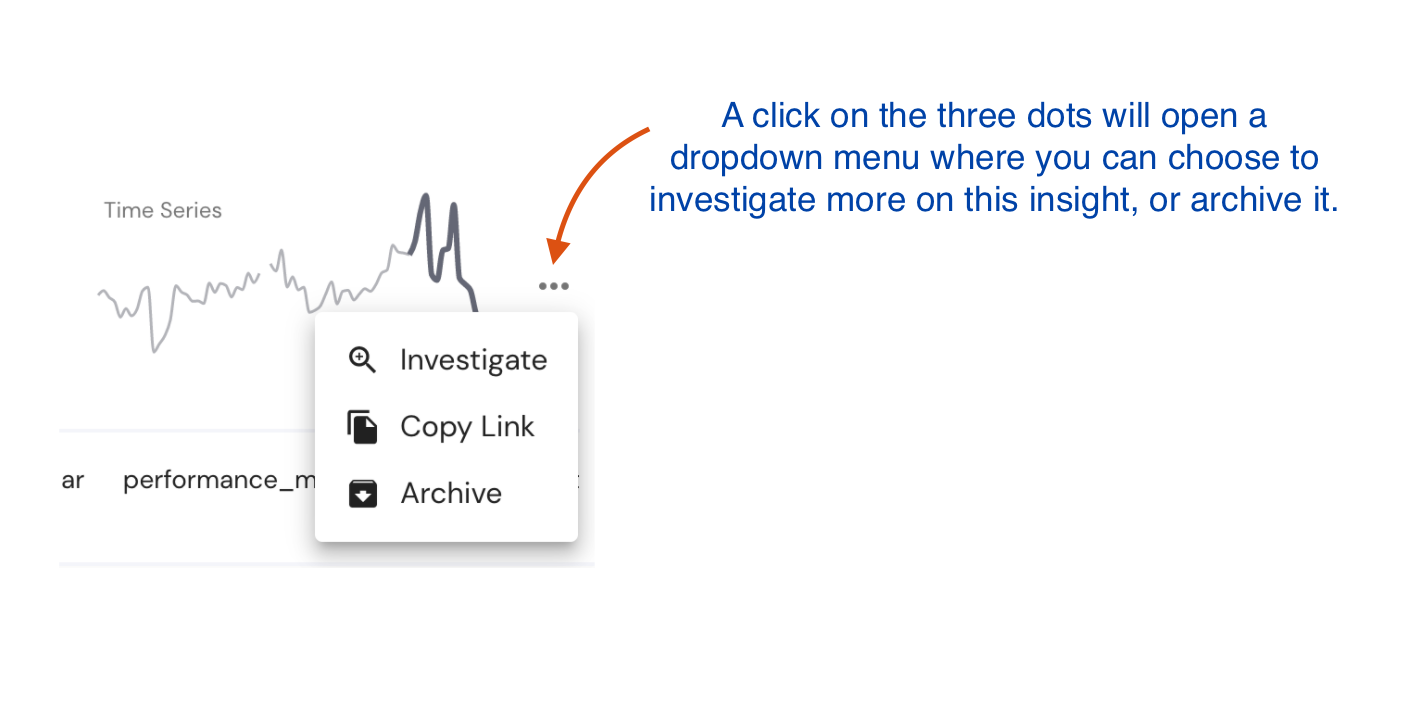
A click on the insight card will open more information regarding this insight.
![Screen Shot 2022-02-14 at 16.06.30.png 1348](https://files.readme.io/351e4d5-Screen_Shot_2022-02-14_at_16.06.30.png)
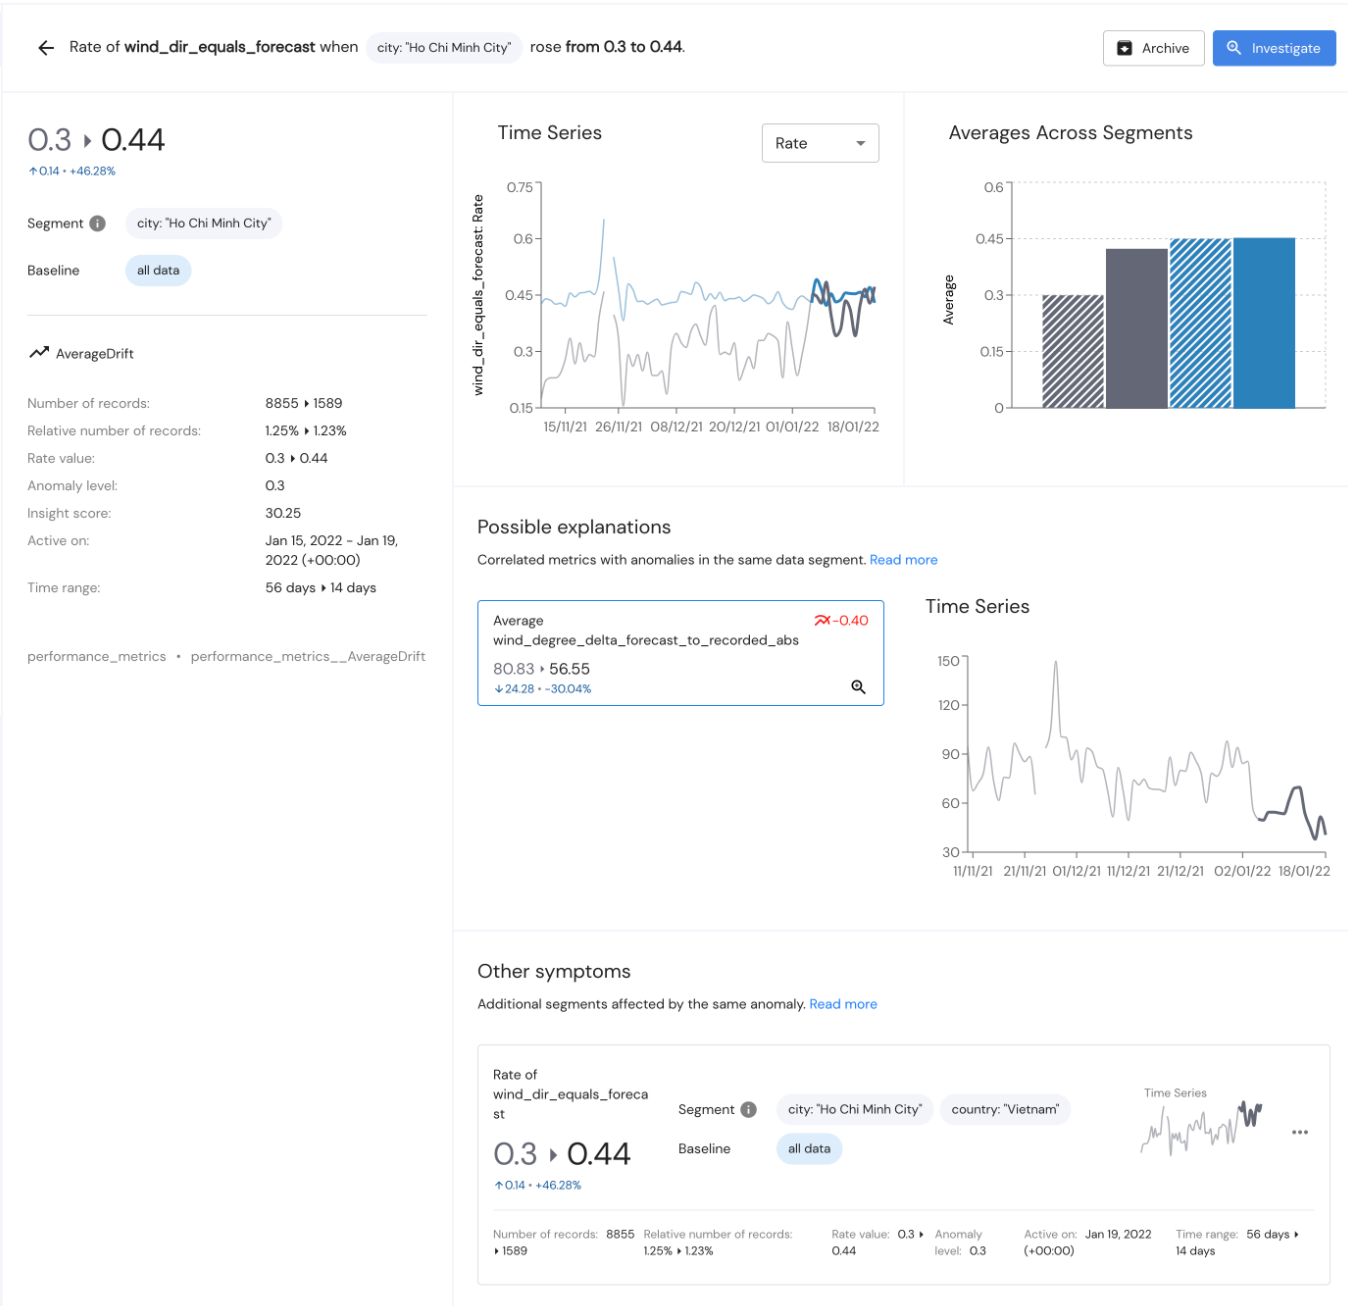
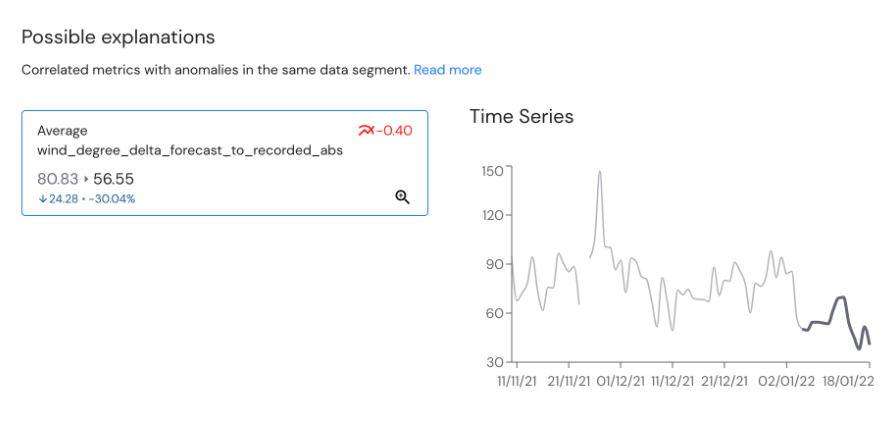
Another feature you will find on the insight page is "possible explanations". These are related anomalies in correlated metrics for each generated insight which make investigating the root cause much easier.
For example in the following screenshot you can see a different metric than the insight's metric which was affected as well and might be the cause for the anomaly.
![Screen Shot 2022-02-14 at 16.06.38.png 896](https://files.readme.io/07c12ac-Screen_Shot_2022-02-14_at_16.06.38.png)
Lastly, at the bottom of the insight page will be a "other symptoms" section, showing other segments in the data which are having the same anomaly in a metric's average, and were grouped under this "parent" insight.
![Screen Shot 2022-02-14 at 16.06.46.png 892](https://files.readme.io/18c2305-Screen_Shot_2022-02-14_at_16.06.46.png)
Updated almost 2 years ago