
Status Check Homepage
Now that the tutorial data was processed and backfilled according to newly created fields, we can now configure the "Status Check Homepage".
Mona's Status Check Homepage is a semi-configurable dashboard that allows users to keep track of important KPIs such as the number of insights, open issues, and specific metrics from across multiple context classes all in one place.

Step 1. Set first KPI - "Number of Records"
- Under the "LOAN_APPLICATION_TUTORIAL" tab, click on the "Edit" icon in the top right corner.
- Click on “Add KPI”.
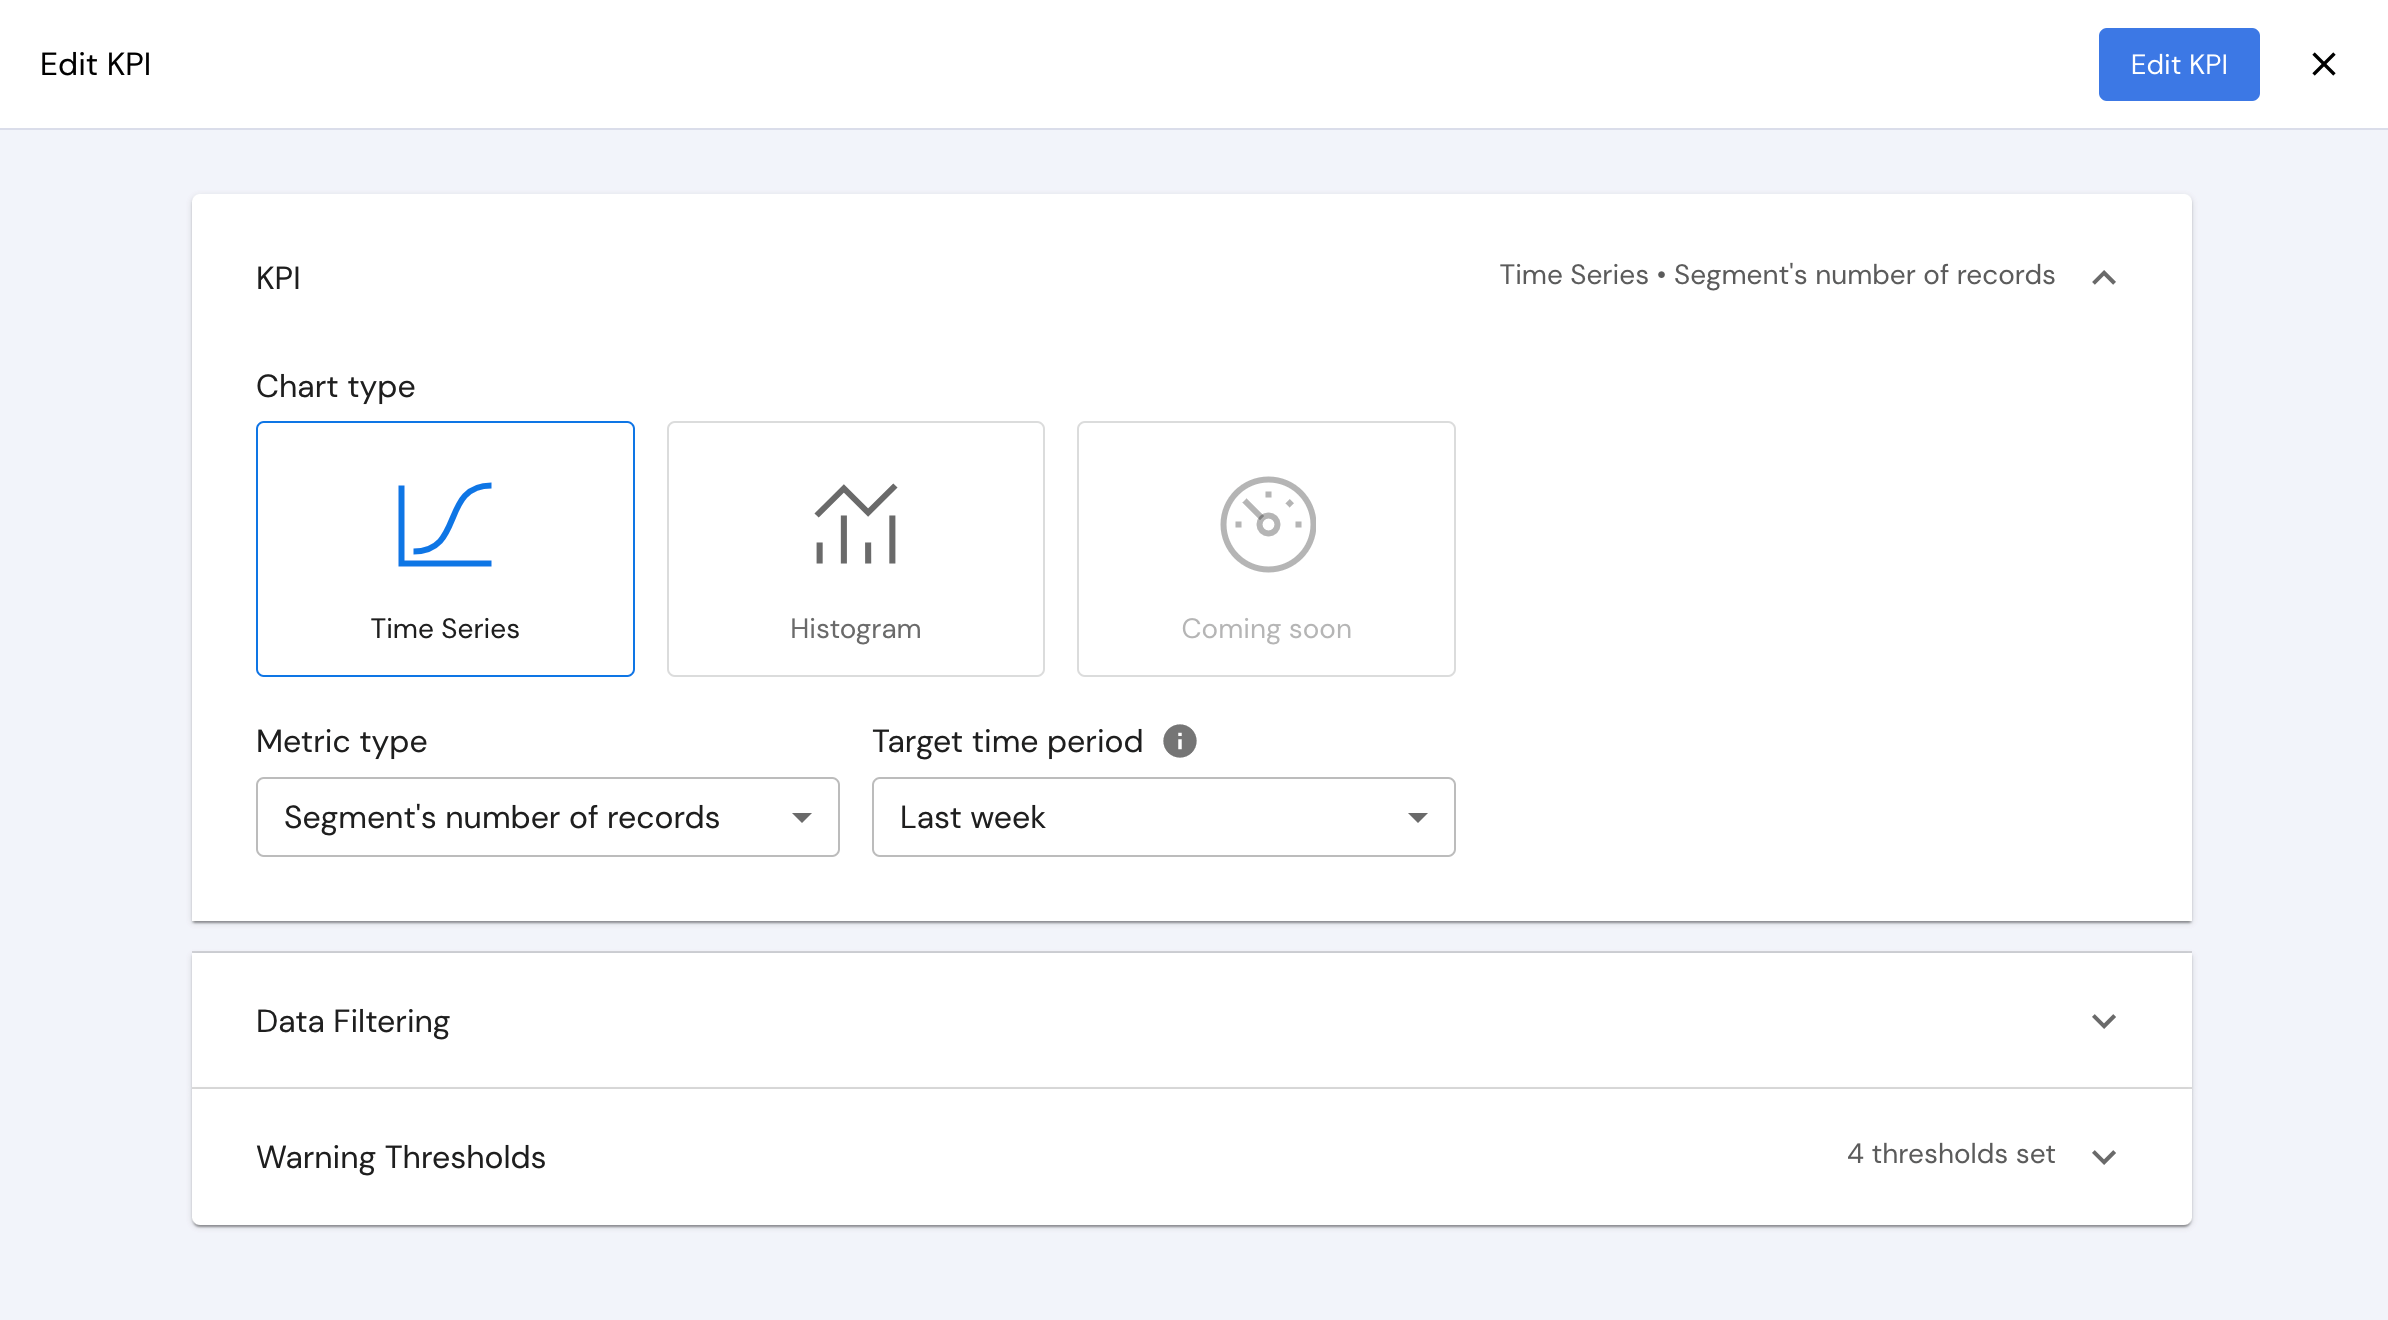
- Under the KPI tab, choose "Chart type" - "Time Series".
- Under "Metric type", choose "Segment's number of records"
- Under "Target time period", choose "Last week".
Step 2. "Number of Records" - Add filters and thresholds
The KPI can be filtered to show only a selected segment of the data, and thresholds can be set to alert you on higher or lower values than normal.
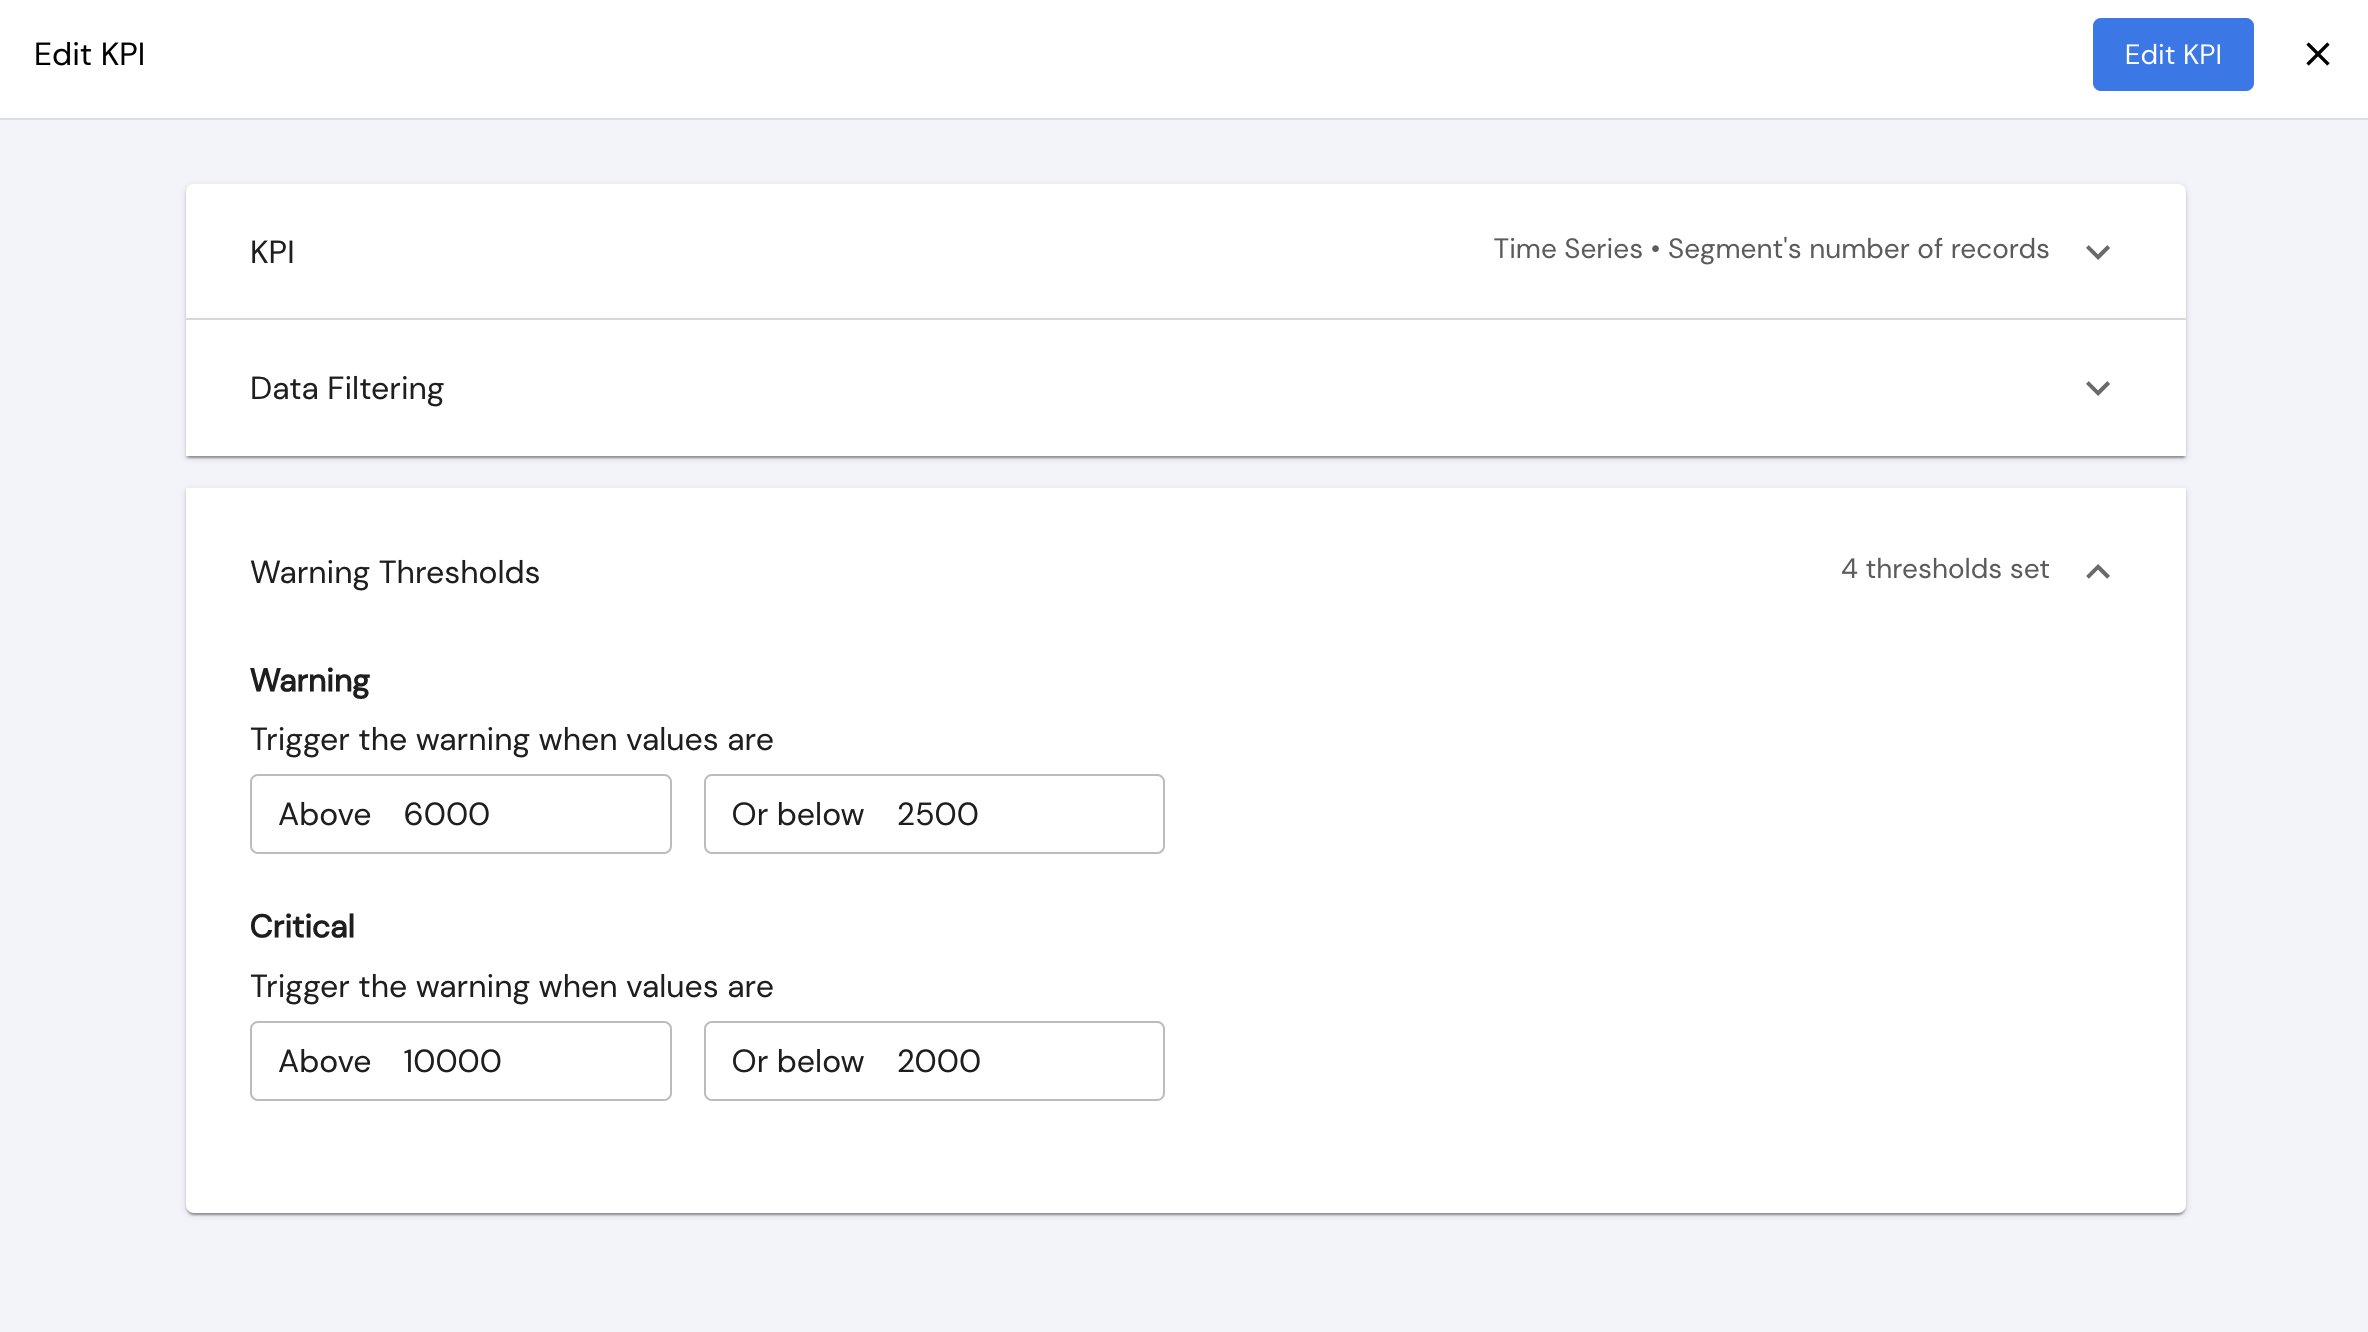
- Under the "Warning Thresholds" tab, for the "Warning" threshold set the "Above" to 6000 and the "Below" to 2500
- For the "Critical" threshold set the "Above" to 10000 and the "Below" to 2000
- Click on "Add KPI", but don't click on "Save" yet.
Step 3. Set second KPI - "Average of credit_score"
- On the same window, click on “Add KPI” again.
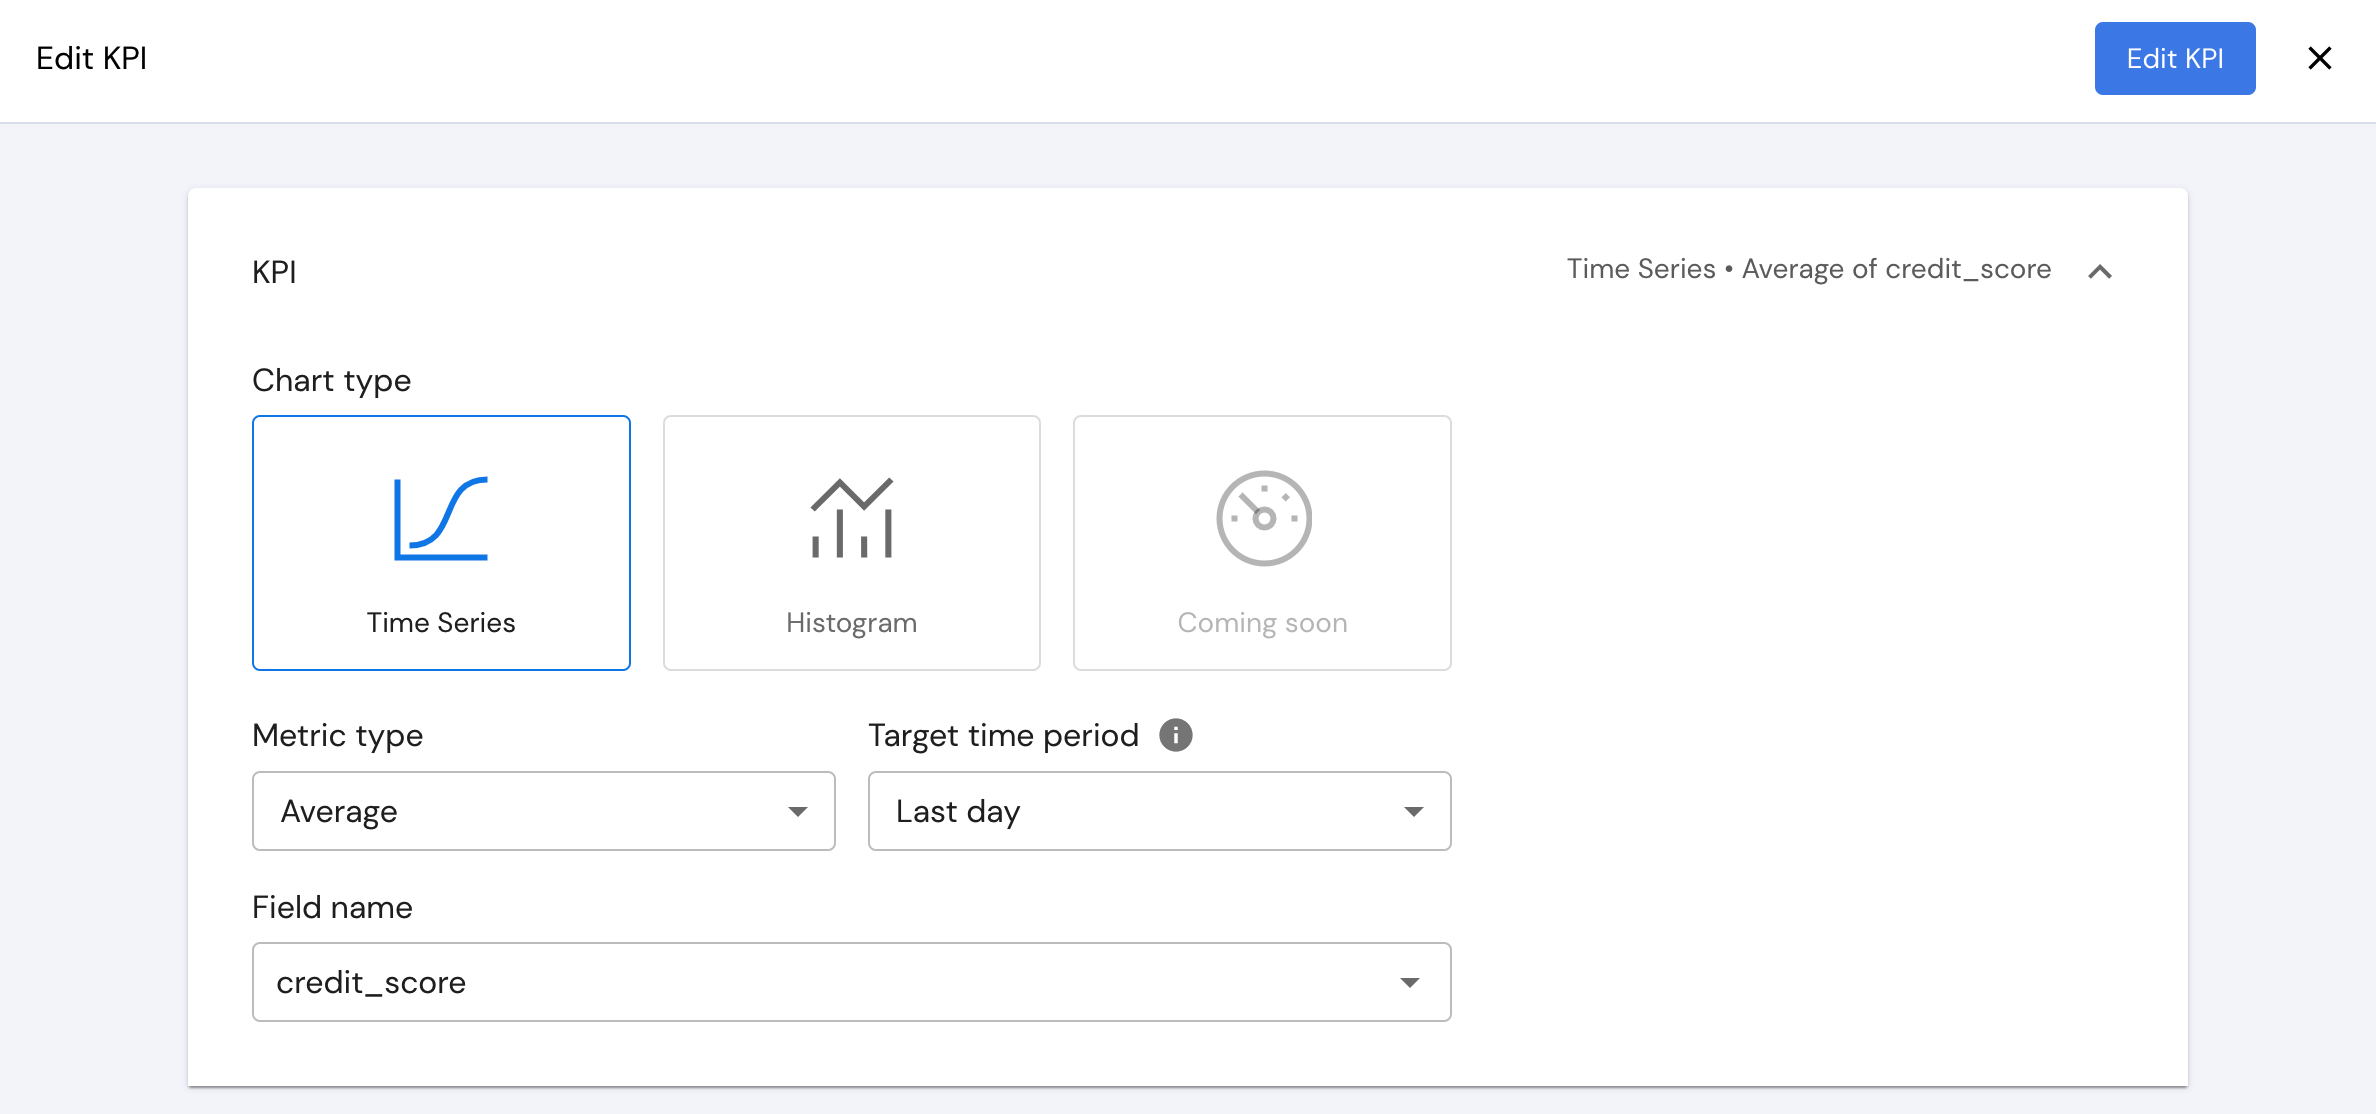
- Under the KPI tab, choose "Chart type" - "Time Series".
- Under "Metric type", choose "Average".
- Under "Target time period", choose "Last day".
- Under "Field name", choose "credit_score"
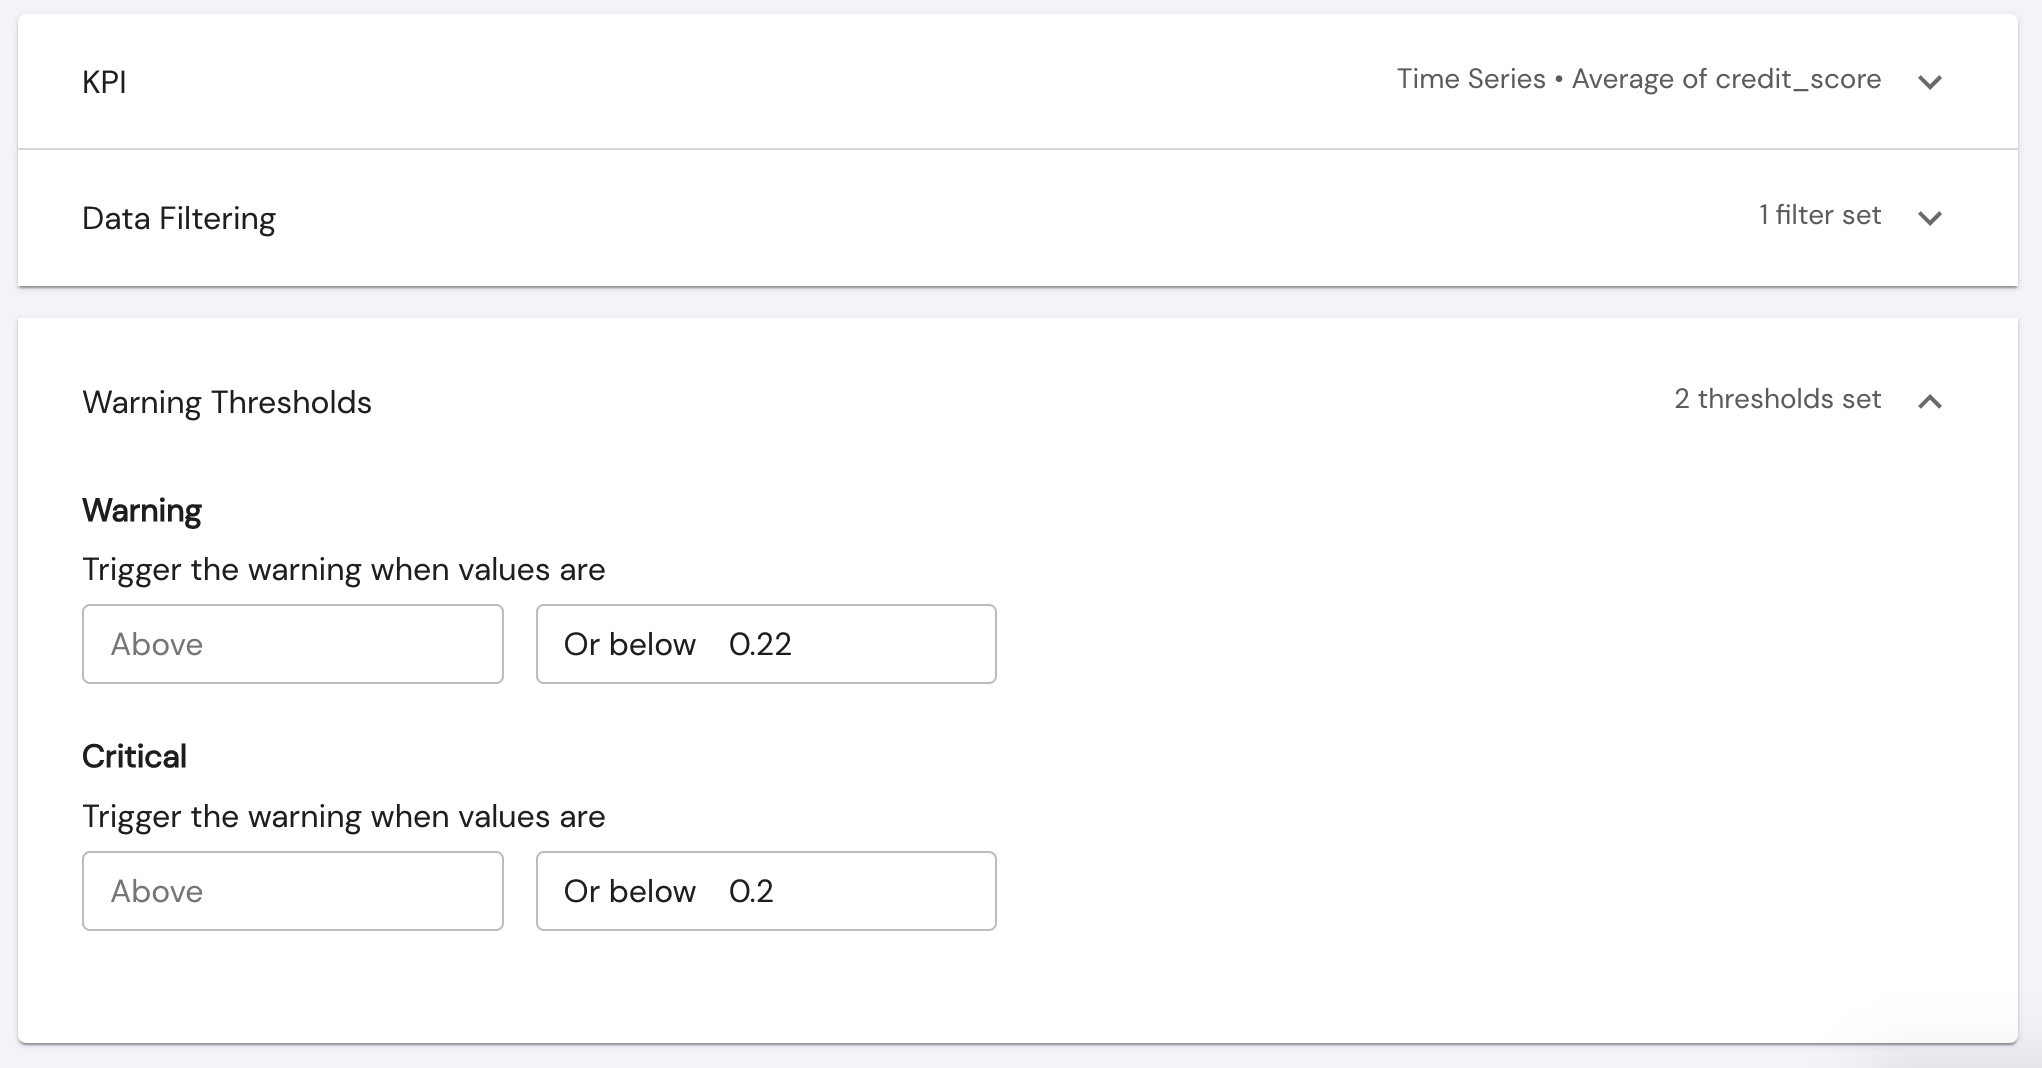
Step 4. "Average of credit_score" - Add filters and thresholds
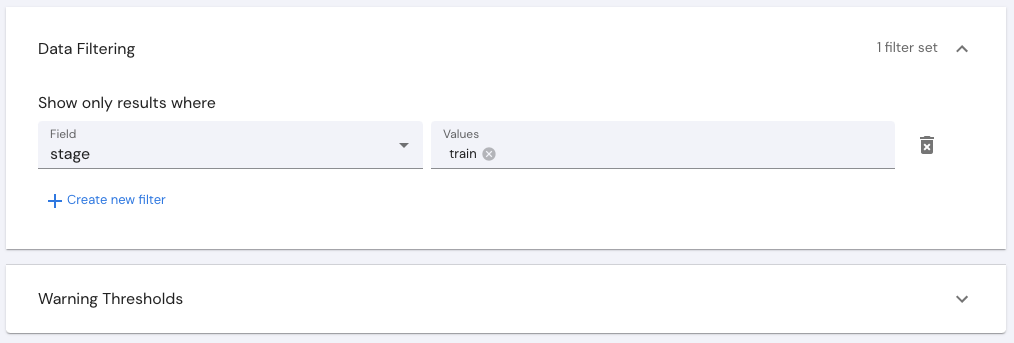
- Under the "Data Filtering" tab, in the "Segment" input, choose "stage".
- In the "Values" input, type "inference" and hit enter.
- Under the "Warning Thresholds" tab, for the "Warning" threshold set the "Below" to 0.22
- For the "Critical" threshold set the "Below" to 0.2
- Click on "Add KPI", but don't click on "Save" yet.
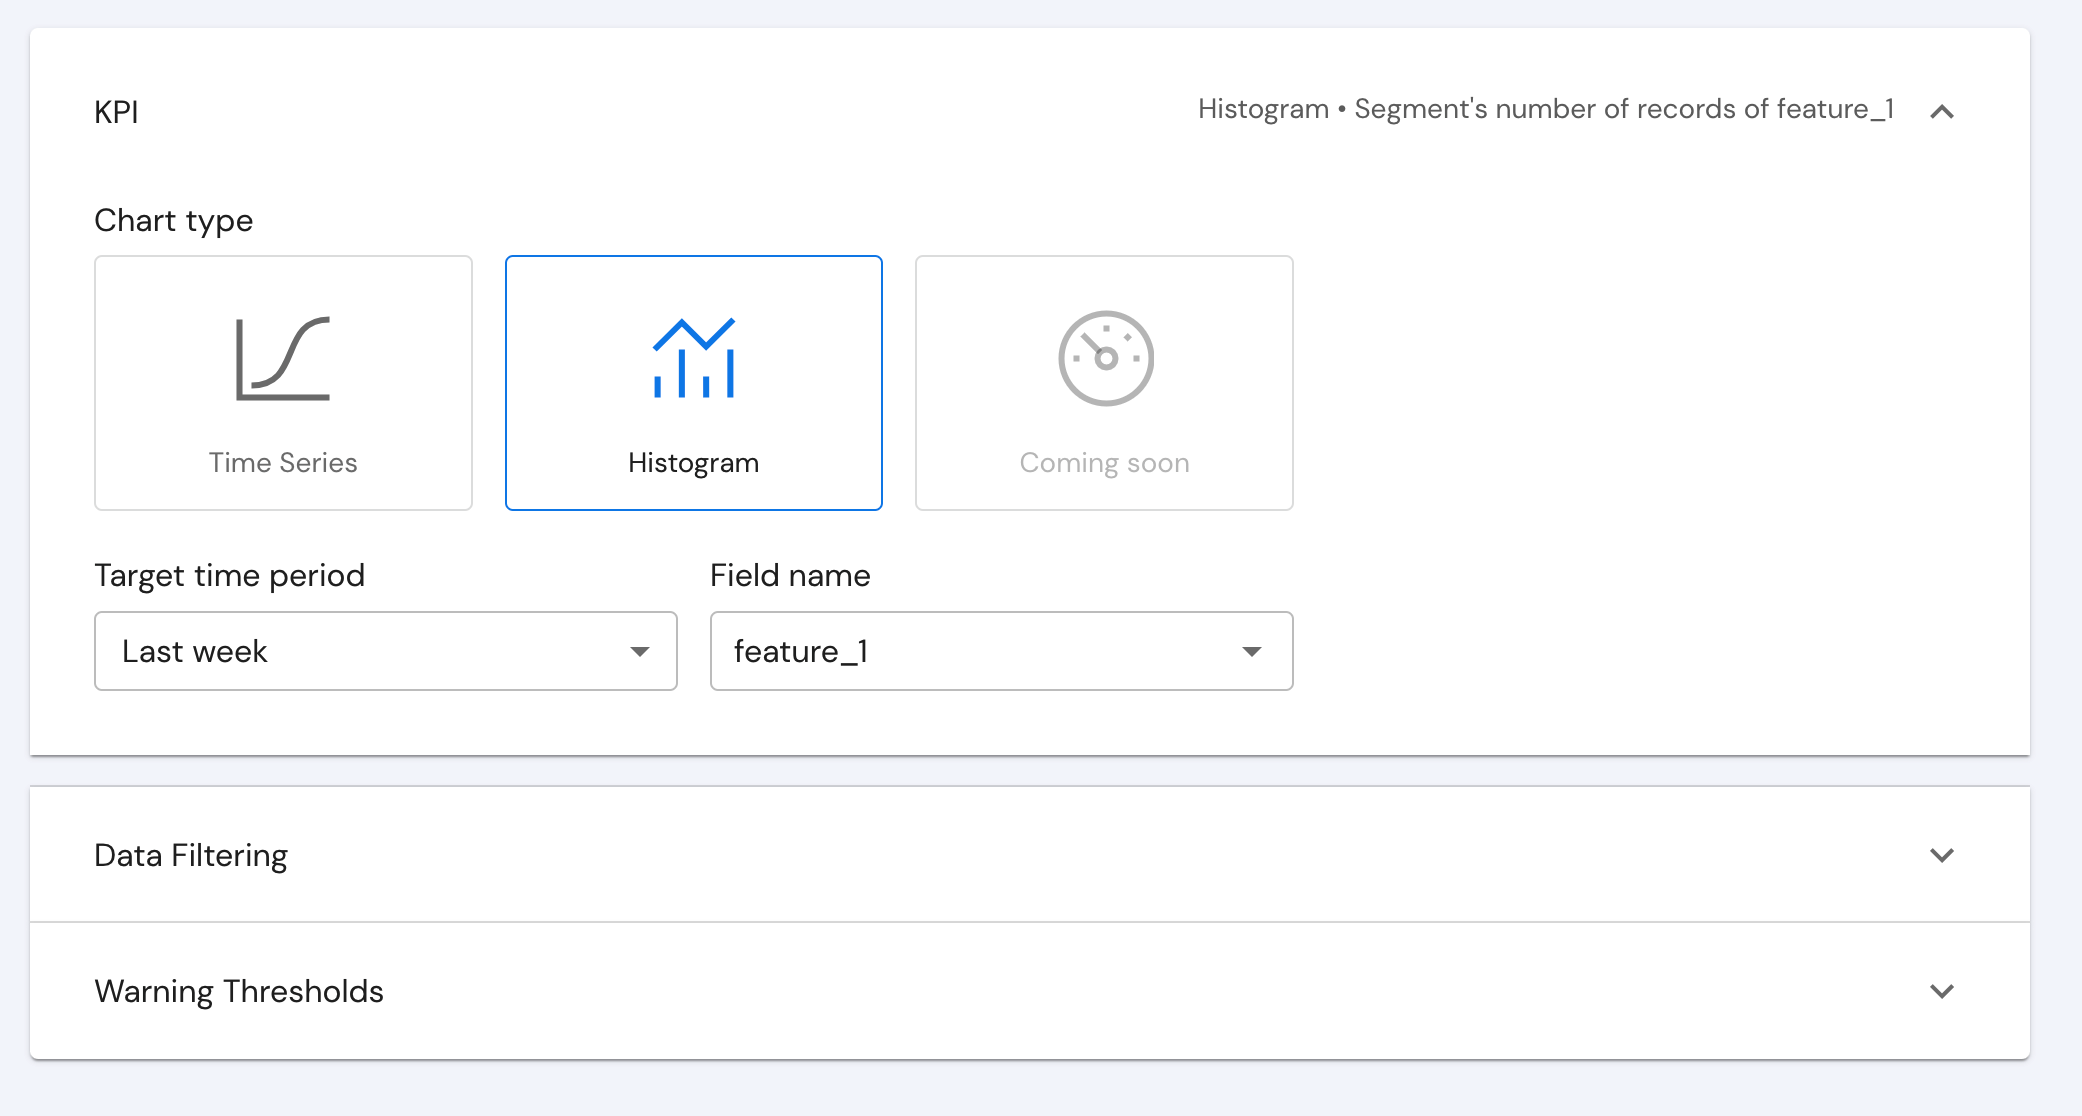
Step 5. Set third KPI - "feature_1"
- On the same window, click on “Add KPI” again.
- Under the KPI tab, choose "Chart type" - "Histogram".
- Under "Target time period", choose "Last week".
- Under "Field name", choose "feature_1.
- Click on "Add KPI", and now, click "Save".
JSON configuration file
The JSON representation of the homepage setup we just configured is as followed:
{
  "YOUR-USER-ID": {
    "LOAN_APPLICATION_TUTORIAL": {
      "fields": {...},
      "stanzas": {...},
      "main_kpis": [
        {
          "chart_type": "time_series",
          "metric": {
            "type": "amount",
            "field": null
          },
          "time_period": "1w",
          "warnings": {
            "low_severity": {
              "below": 2500,
              "above": 6000
            },
            "high_severity": {
              "below": 2000,
              "above": 10000
            }
          },
          "data_segment": {}
        },
        {
          "chart_type": "time_series",
          "metric": {
            "type": "average",
            "field": "credit_score"
          },
          "time_period": "1d",
          "warnings": {
            "high_severity": {
              "below": 0.2
            },
            "low_severity": {
              "below": 0.22
            }
          },
          "data_segment": {
            "stage": [
              {
                "value": "inference"
              }
            ]
          }
        },
        {
          "chart_type": "histogram",
          "metric": {
            "type": "sum",
            "field": "feature_1"
          },
          "time_period": "1w",
          "warnings": {
            "high_severity": {}
          },
          "data_segment": {}
        }
      ]
    }
  }
}
References:\ Status Check Homepage
Updated 3 months ago