Status Check Homepage
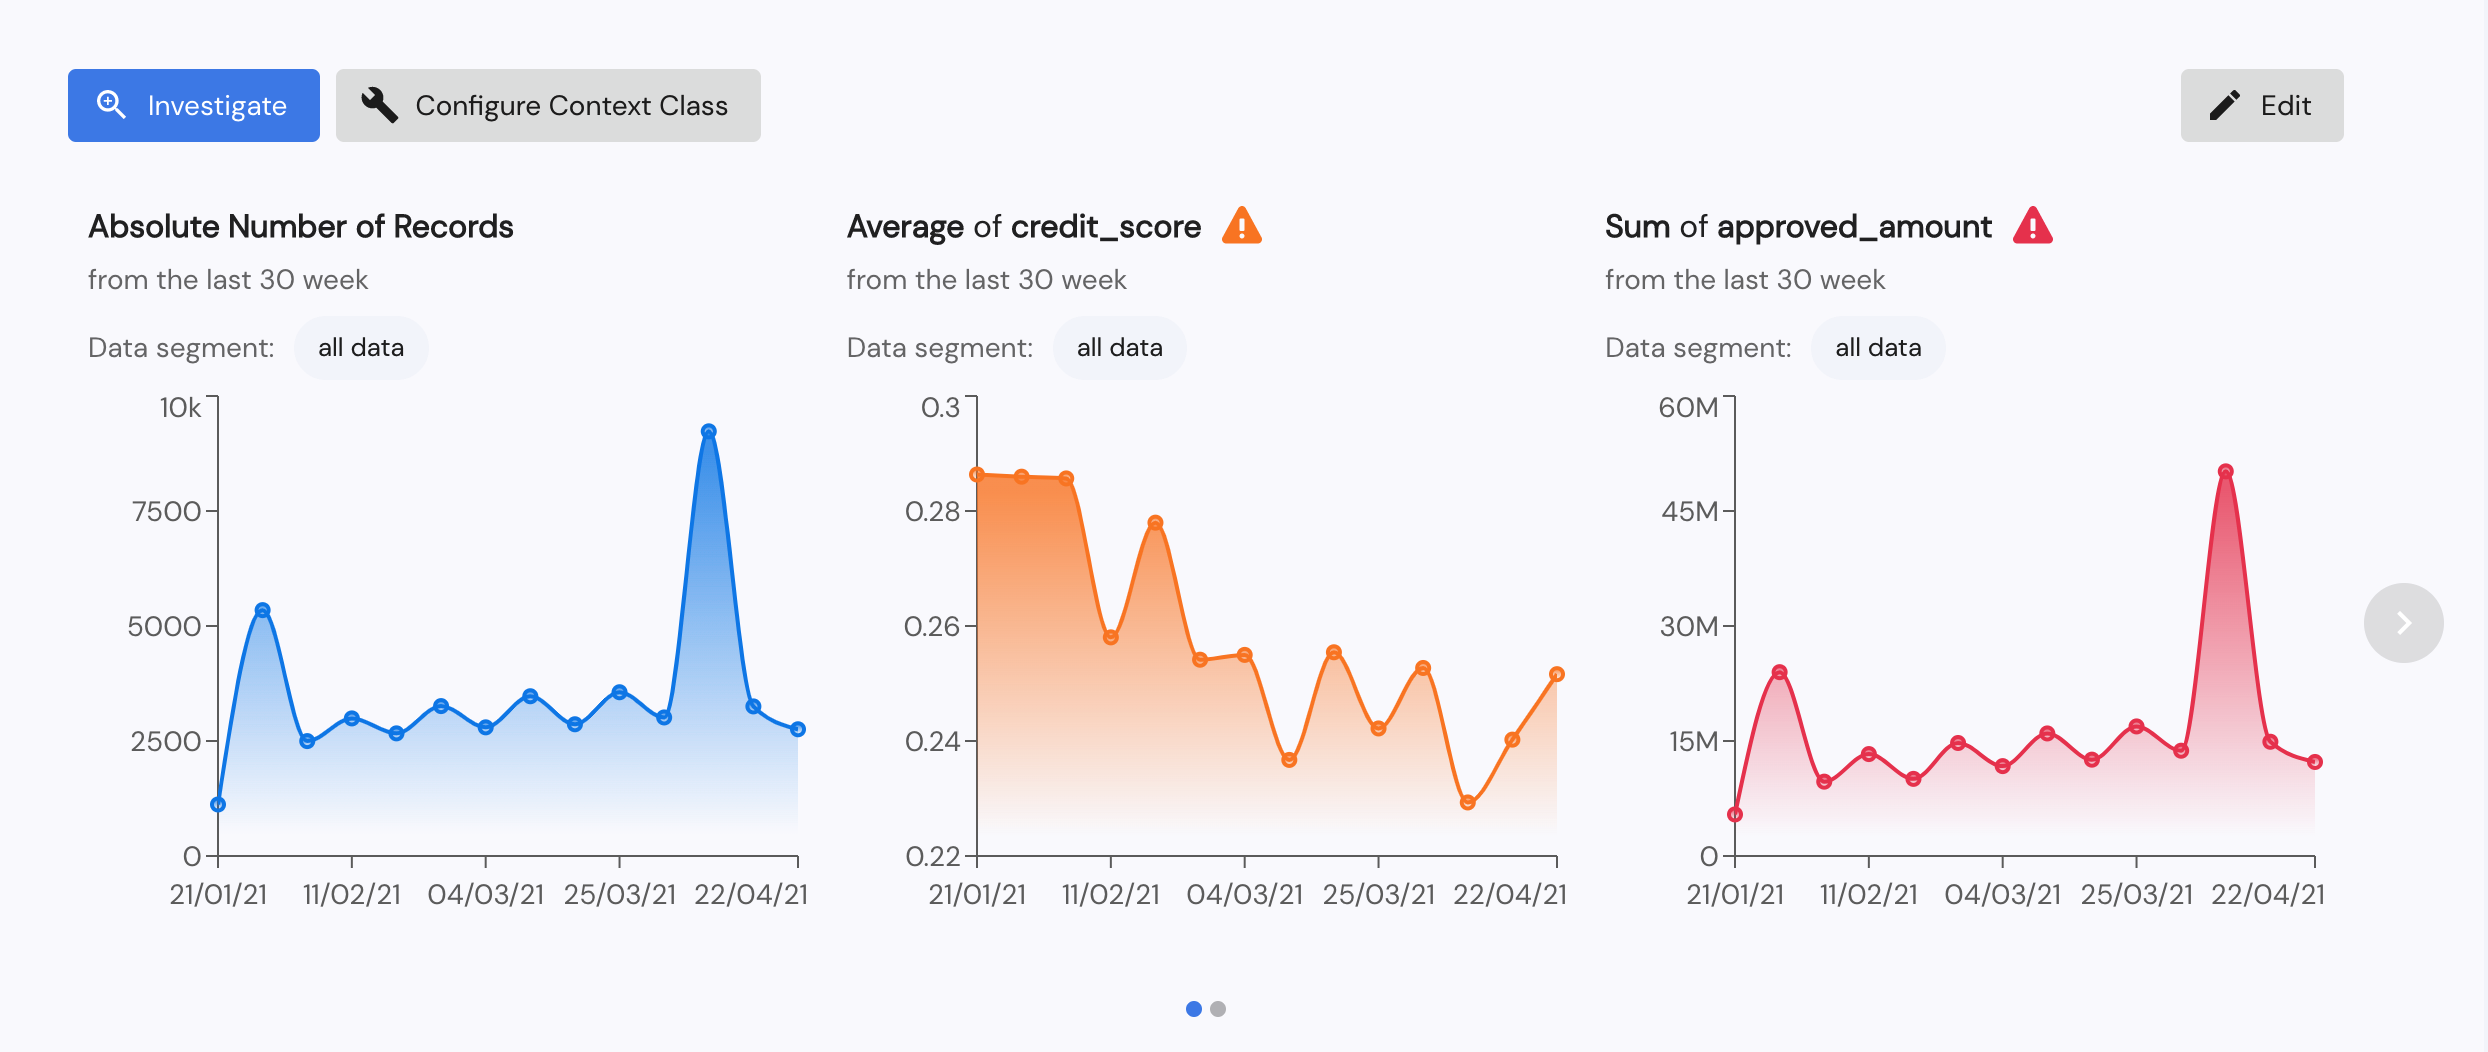
Mona's Status Check Homepage is a semi-configurable dashboard that allows users to keep track of important KPIs such as the number of active or urgent insights, open issues, and specific metrics from across multiple context classes all in one place.
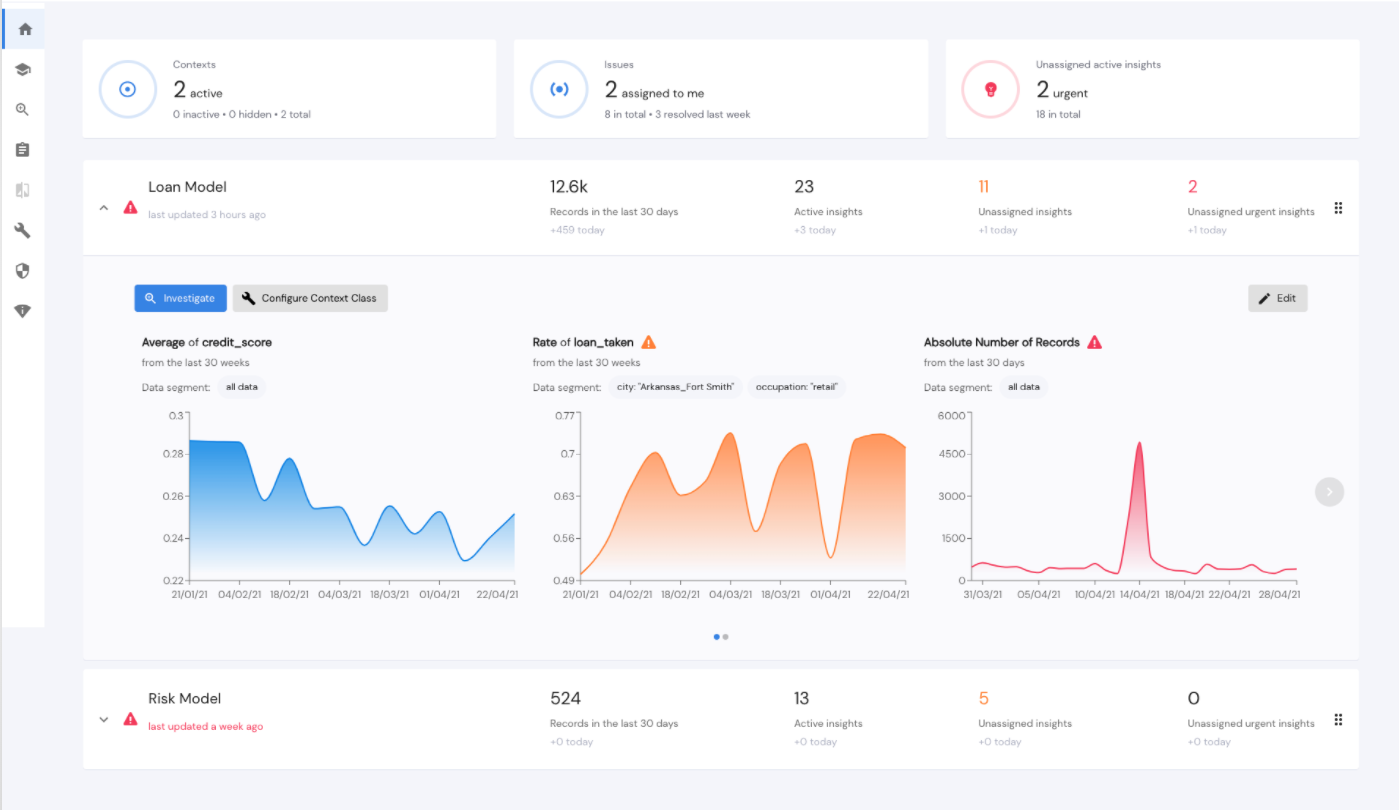
Add, remove or edit existing metric-based charts for each context class with ease directly via the homepage edit button, or via the JSON configuration file, and configure different levels of alerting based on the values of those metrics.
Initial setup
Set each class's main KPI's by clicking on the "Edit" button and then "Add KPI". In the KPI configuration, choose the "Chart type". Currently supported types are "Time Series" and "Histogram", but more to be added soon.
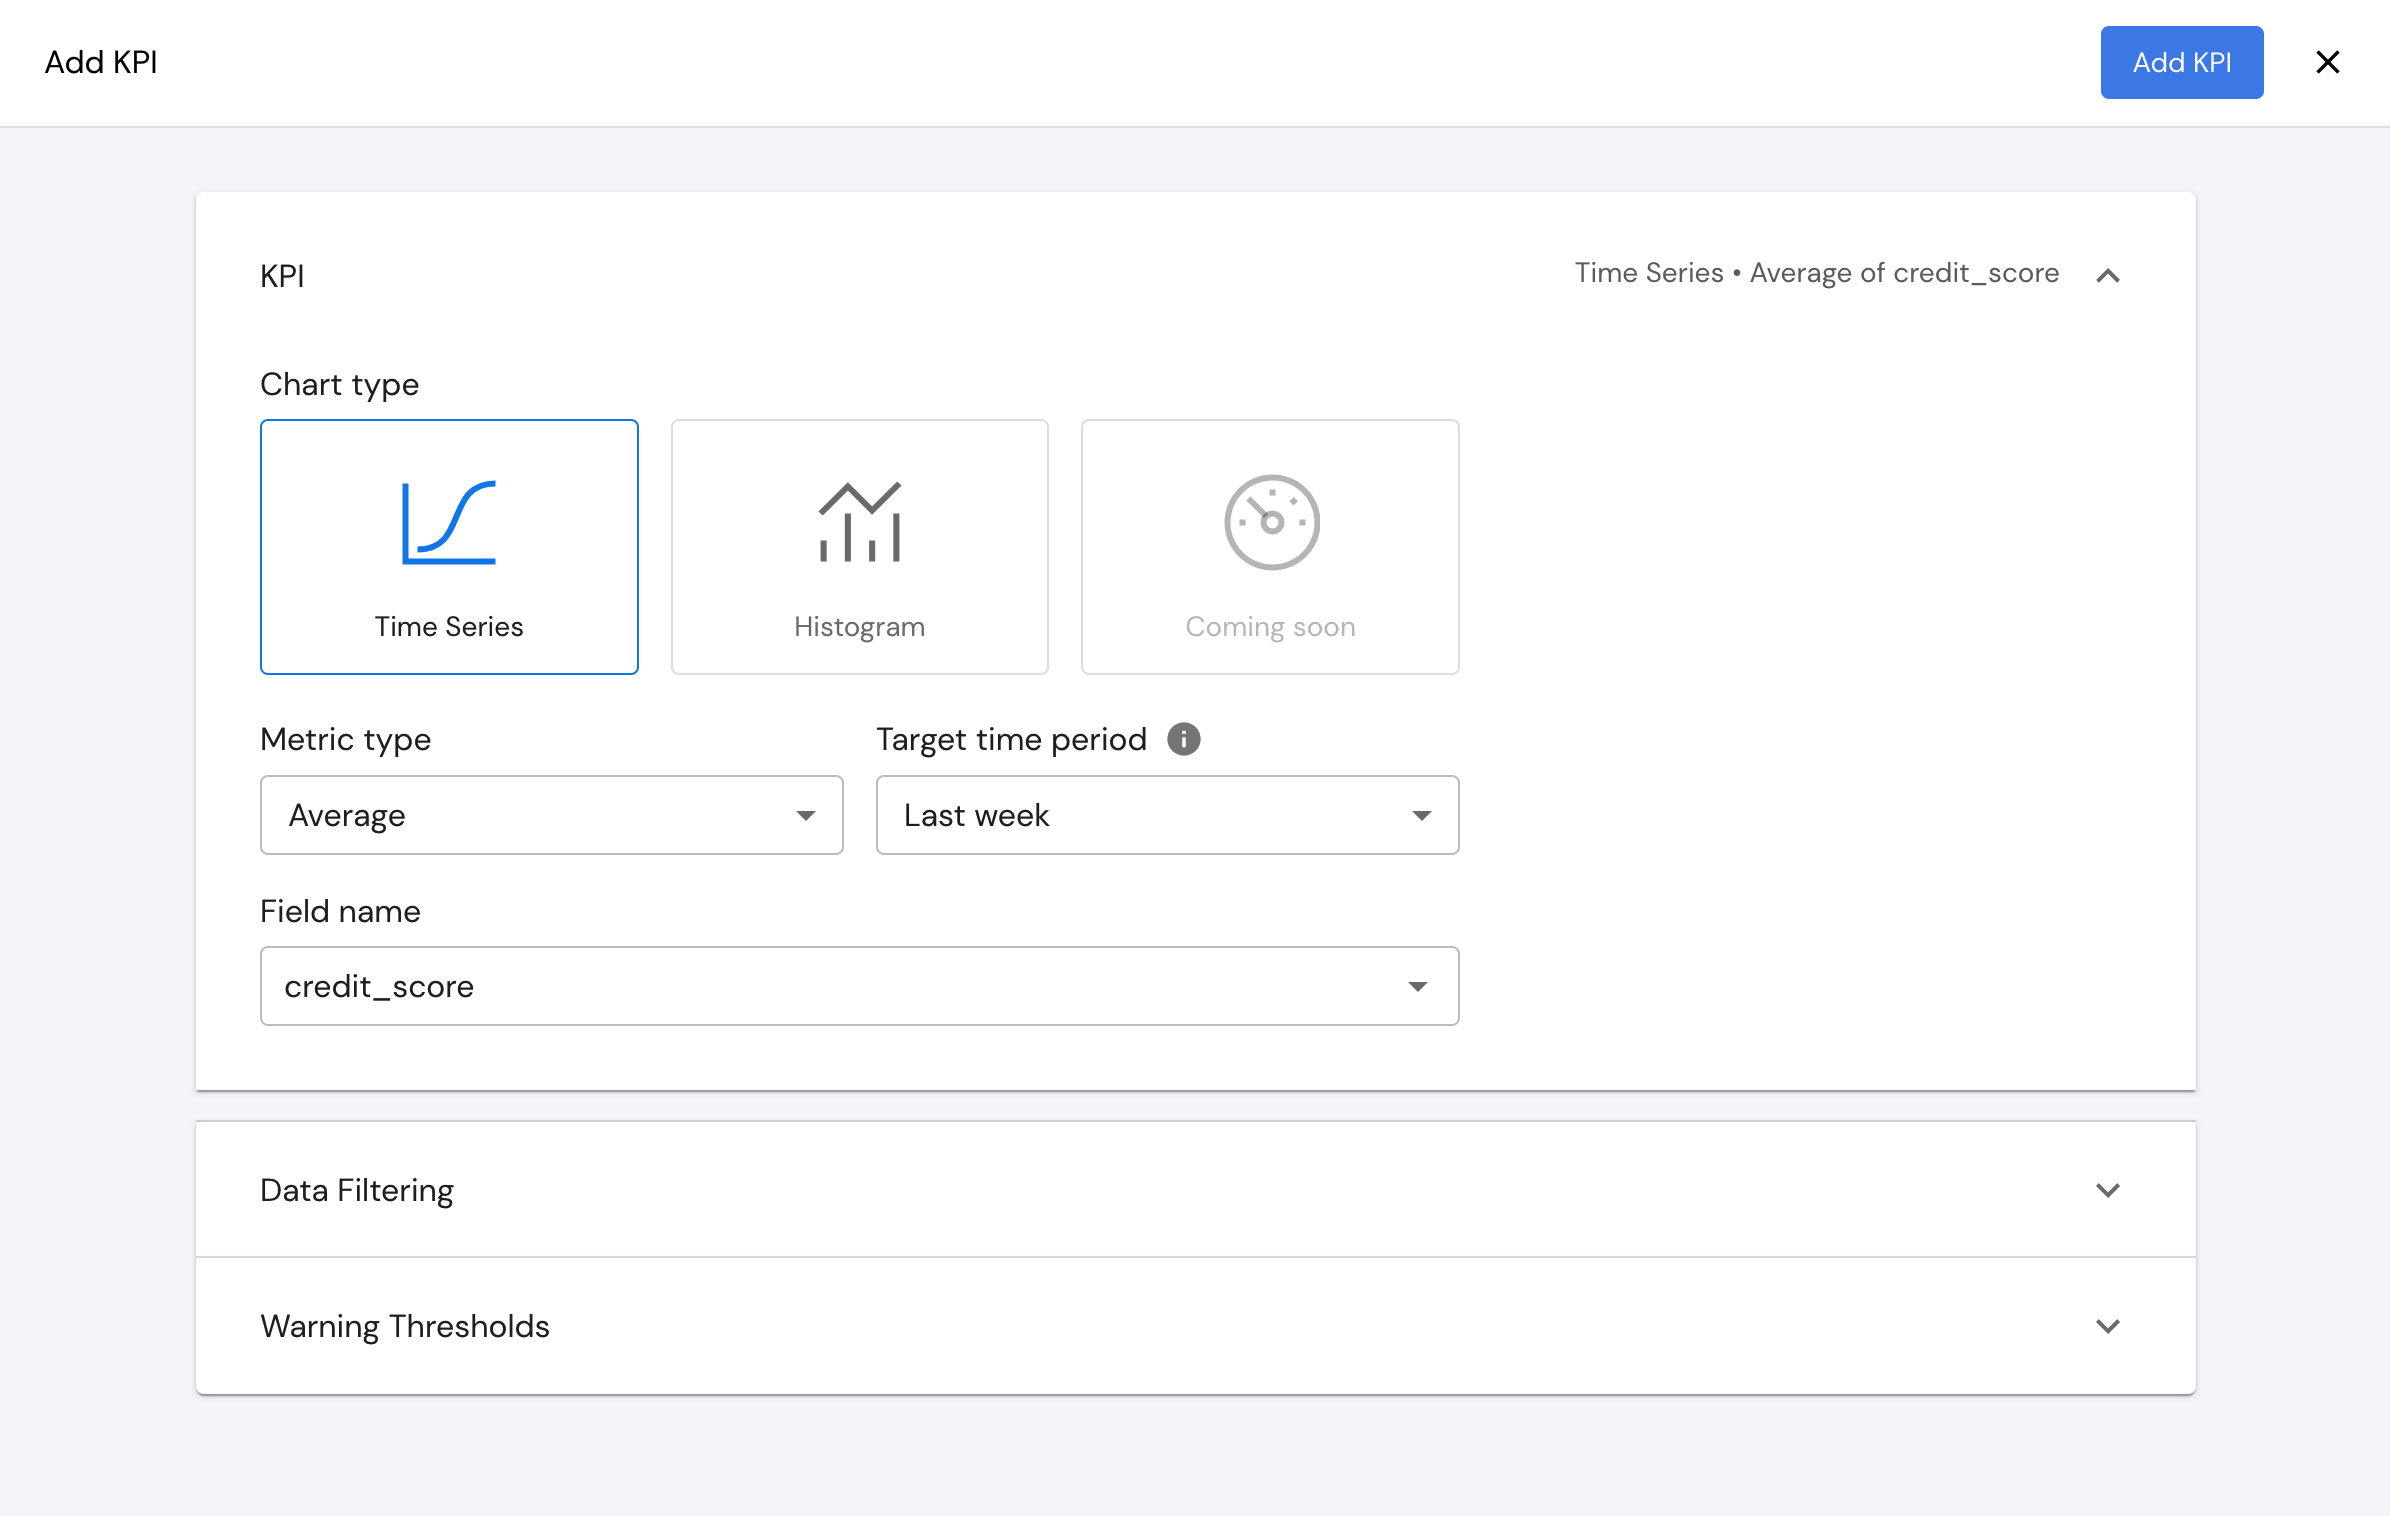
Once the Chart type is chosen, configure the following:
- "Metric type" - either "Number of records", "Average", "Sum" or "Variance"
- "Target time period" - either "Last day", "Last week" or "Last month". Will also be used as the time resolution.
- "Field name" - if the Metric type is "Average", "Sum" or "Variance", choose the metric you wish to track.
Data Filtering
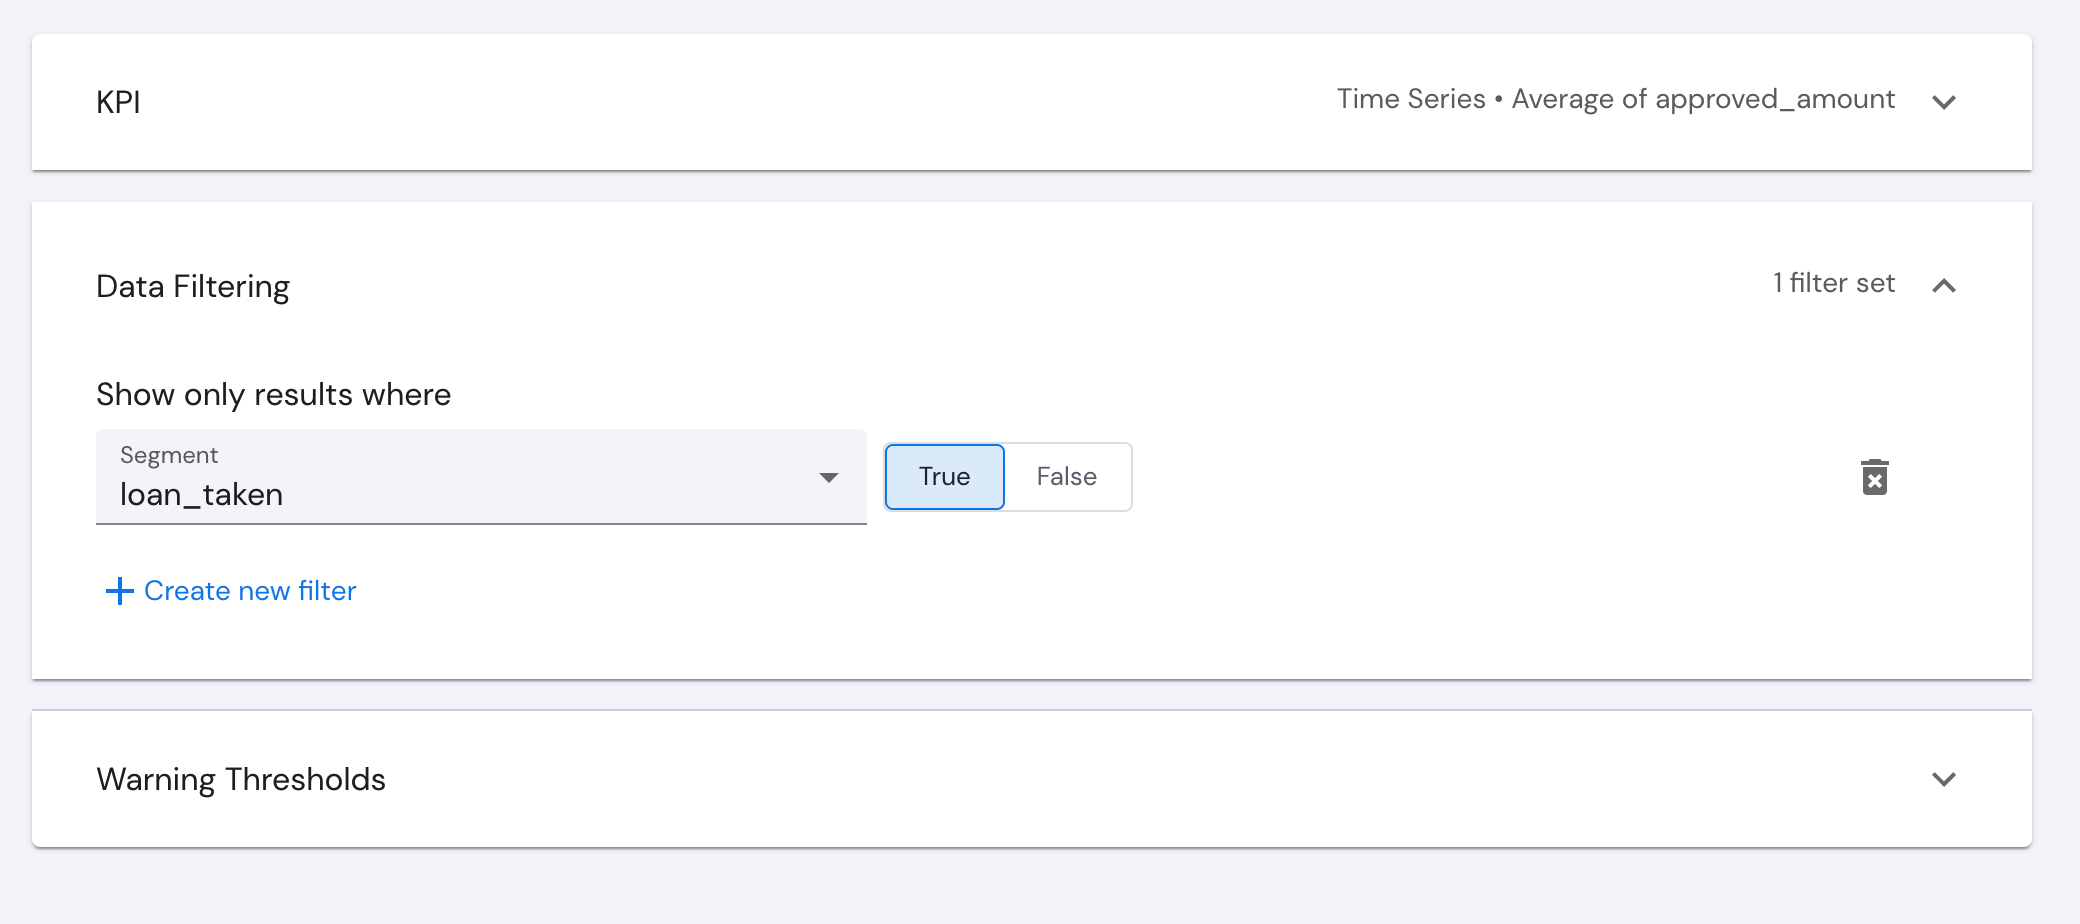
Users can filter the data shown on a specific chart on the homepage to a specific segment. For example, only data from a specific "City", or only data with a "Credit Score" between 0.7 and 0.9.
Warning Thresholds
Set up different levels of alerts - either "Warning" or "Critical", based on the chosen KPI values.
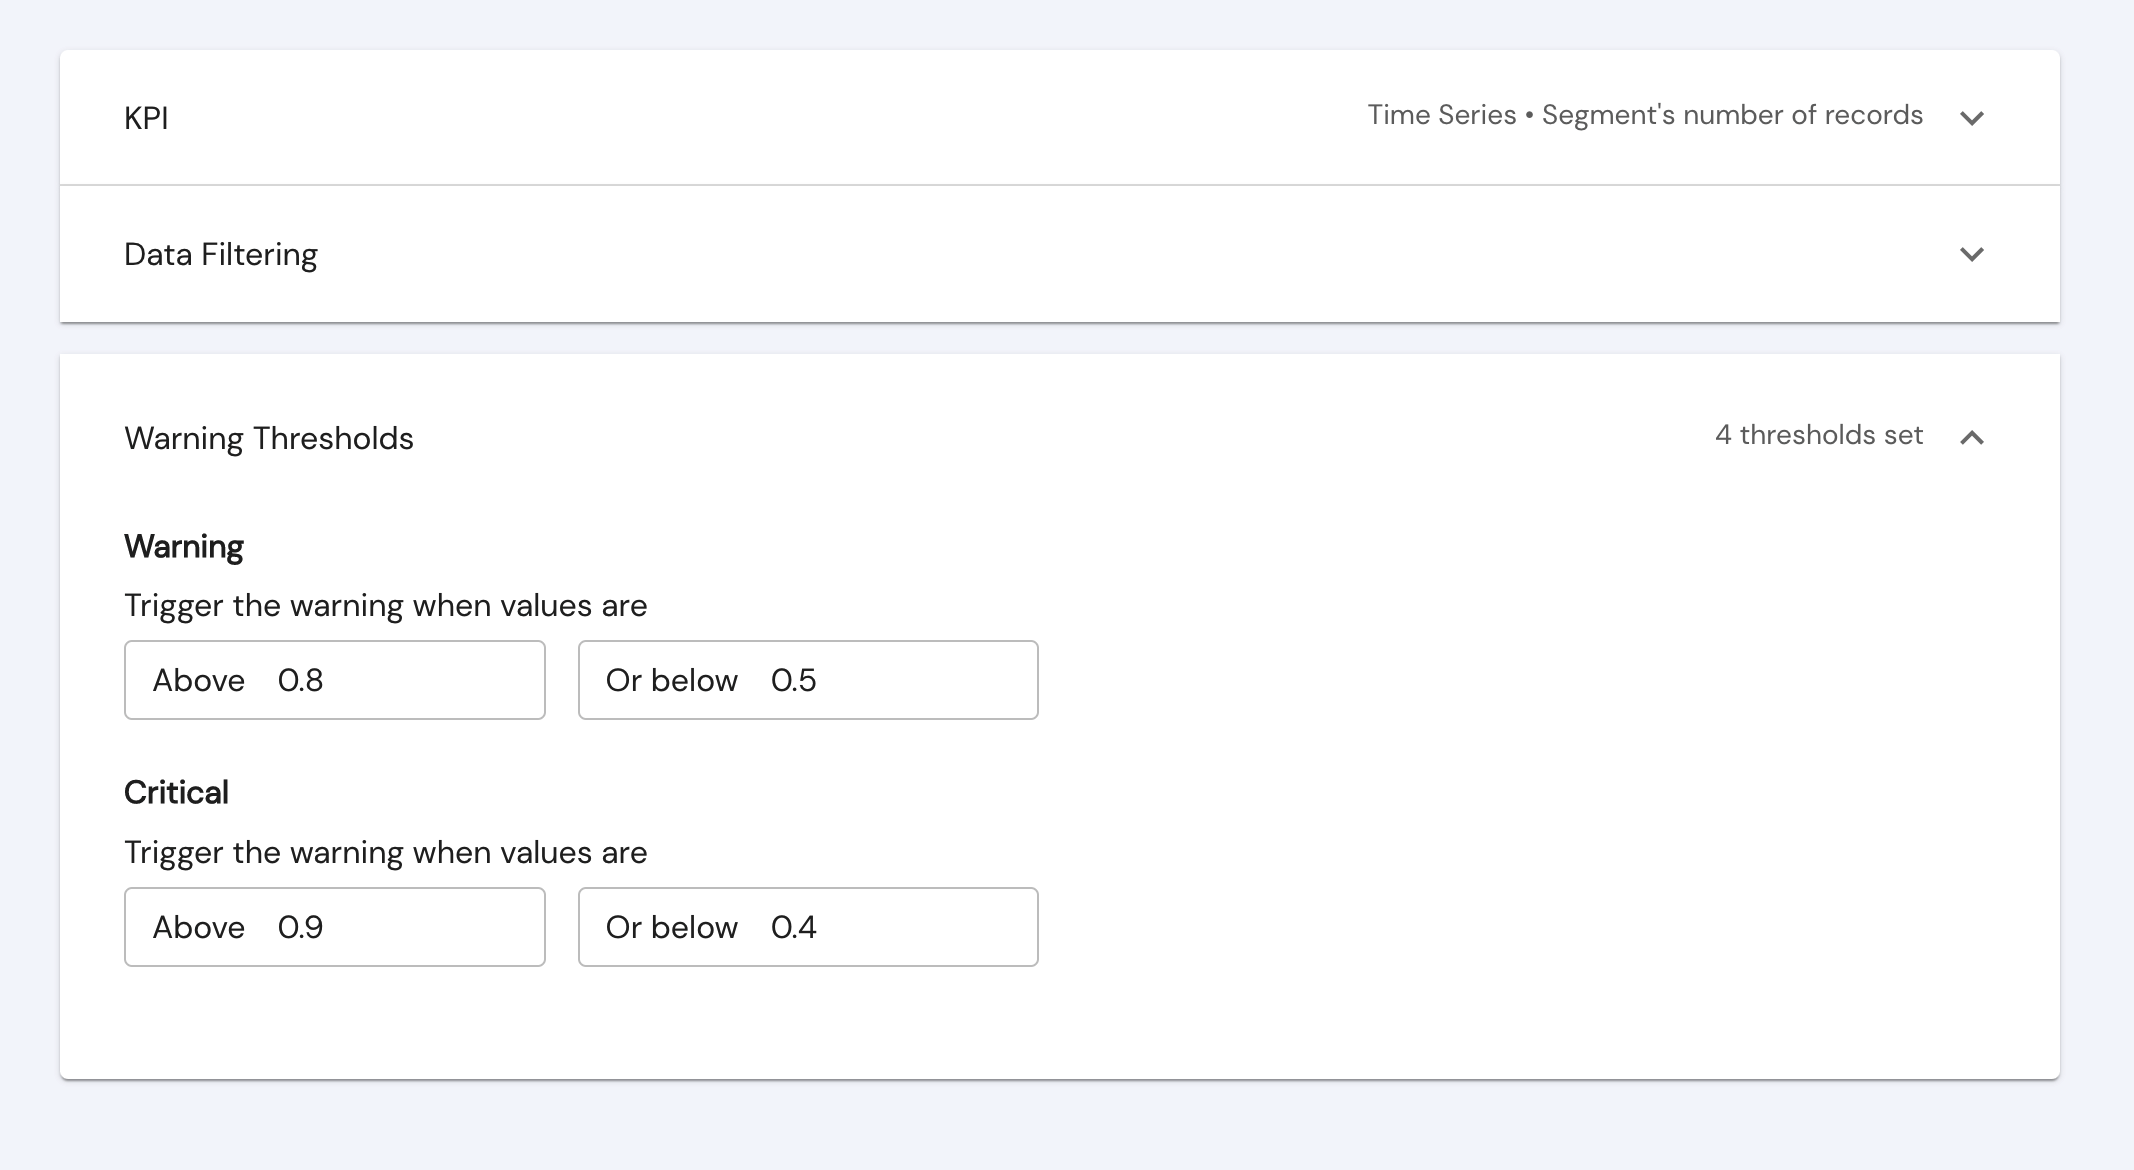
Users can choose to set either both "Above" and "Below" thresholds, e.g "Above" - 0.8 and "Below" - 0.5, or just one of those thresholds. If the KPI value is above or below the set threshold, the chart will change color from blue to orange in the "Warning" threshold or red in the "Critical" threshold.
JSON configuration file
The homepage configuration can also be set via the JSON config file. Below is an example of such a configuration. Note that this configuration is per context class.
{
  "YOUR-USER-ID": {
    "CONTEXT-CLASS-NAME": {
      "fields": {...},
      "stanzas": {...},
      "main_kpis": [
       {
          "chart_type": "histogram",
          "metric": {
            "type": "average",
            "field": "credit_score"
          },
          "time_period": "1w",
          "warnings": {
            "high_severity": {
              "below": 0.1,
              "above": 0.8
            },
            "low_severity": {
              "below": 0.2,
              "above": 0.4
            }
          },
          "data_segment": {
            "label": [
              {
                "value": true
              }
            ]
          }
        },
        {
          "chart_type": "time_series",
          "metric": {
            "type": "average",
            "field": "loan_taken"
          },
          "time_period": "1w",
          "warnings": {
            "high_severity": {
              "below": 0.1,
              "above": 0.8
            },
            "low_severity": {
              "below": 0.2,
              "above": 0.4
            }
          },
          "data_segment": {
            "city": [
              {
                "value": "Arkansas_Fort Smith"
              }
            ],
            "occupation": [
              {
                "value": "retail"
              }
            ]
          }
        },
        {
          "chart_type": "time_series",
          "metric": {
            "type": "amount",
            "field": null
          },
          "time_period": "1d",
          "warnings": {
            "high_severity": {
              "above": 0.8,
              "below": 0.2
            },
            "low_severity": {
              "above": 0.5,
              "below": 0.3
            }
          },
          "data_segment": {
            "loan_taken": [
              {
                "value": true
              }
            ]
          }
        }
      ]
    }
  }
}
Updated 3 months ago
